. 2008 Oct 22;28(43):11042-60.
doi: 10.1523/JNEUROSCI.2334-08.2008.

Large-scale reorganization in the somatosensory cortex and thalamus after sensory loss in macaque monkeys

Affiliations

Large-scale reorganization in the somatosensory cortex and thalamus after sensory loss in macaque monkeys

Neeraj Jain et al. J Neurosci. .

Abstract

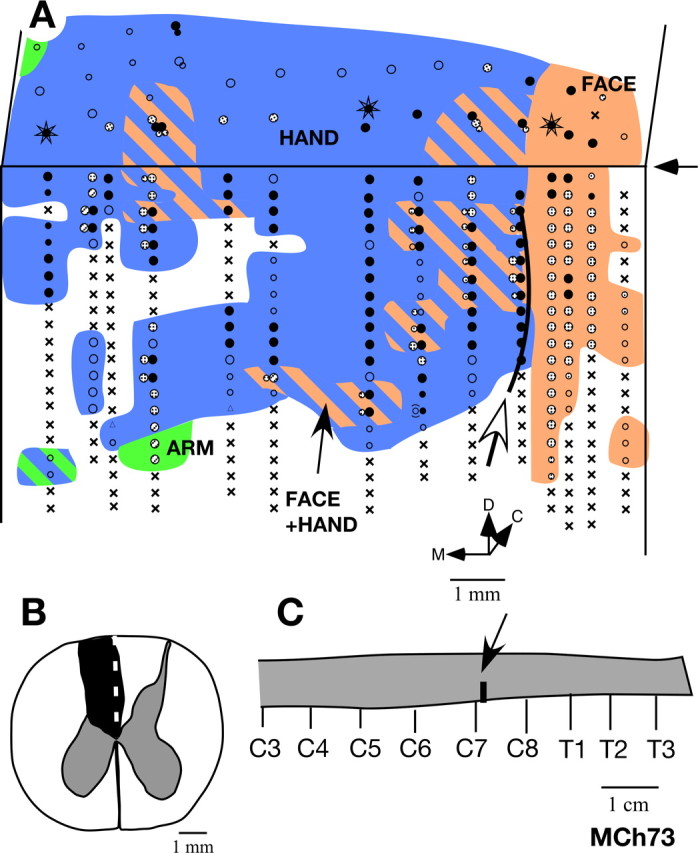
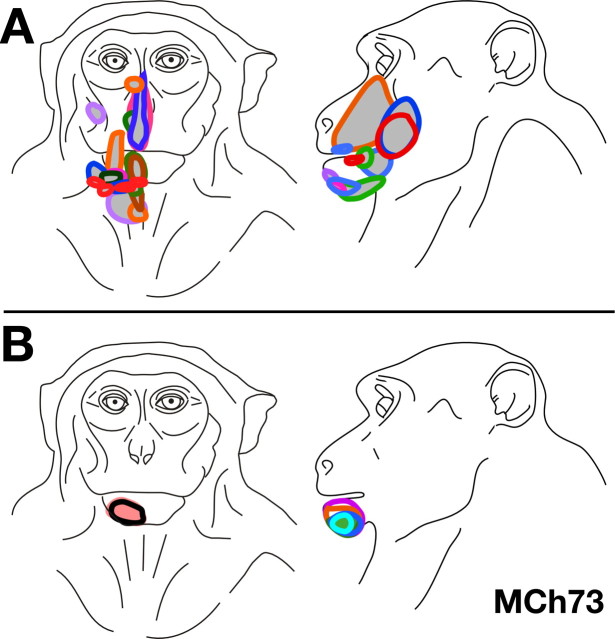
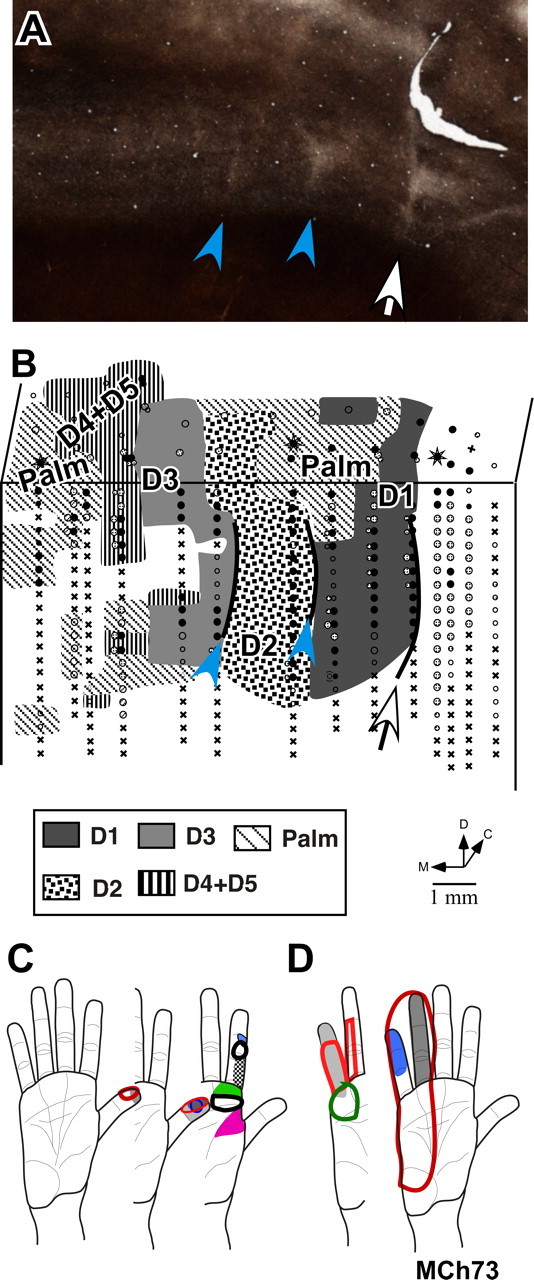
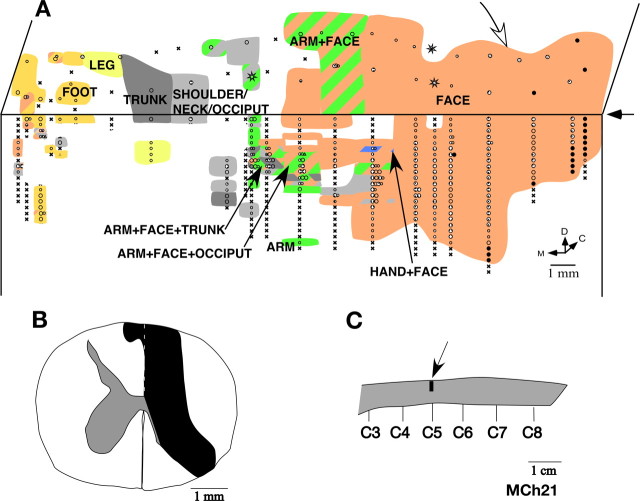
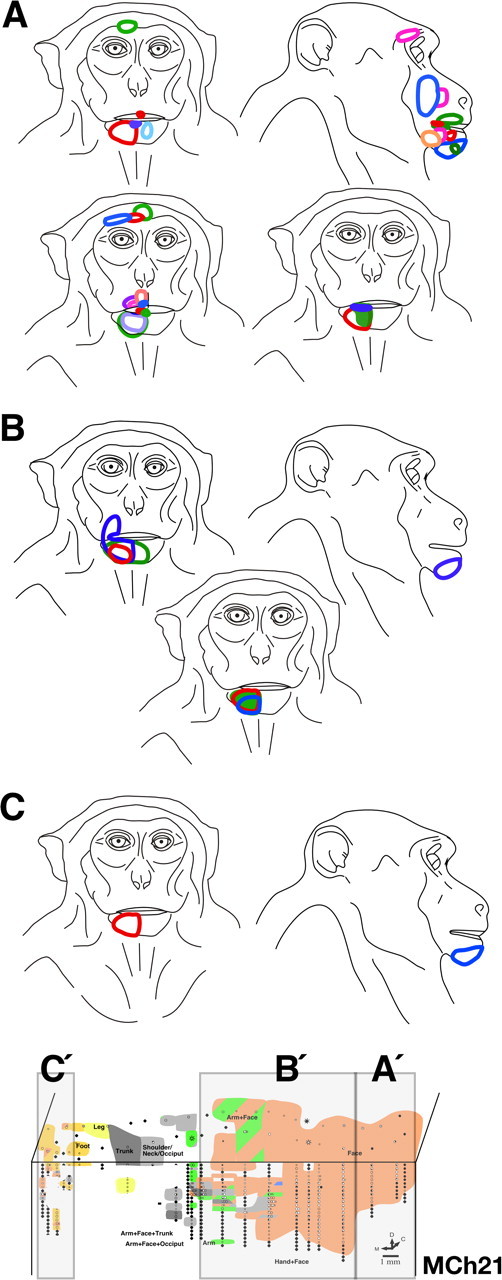
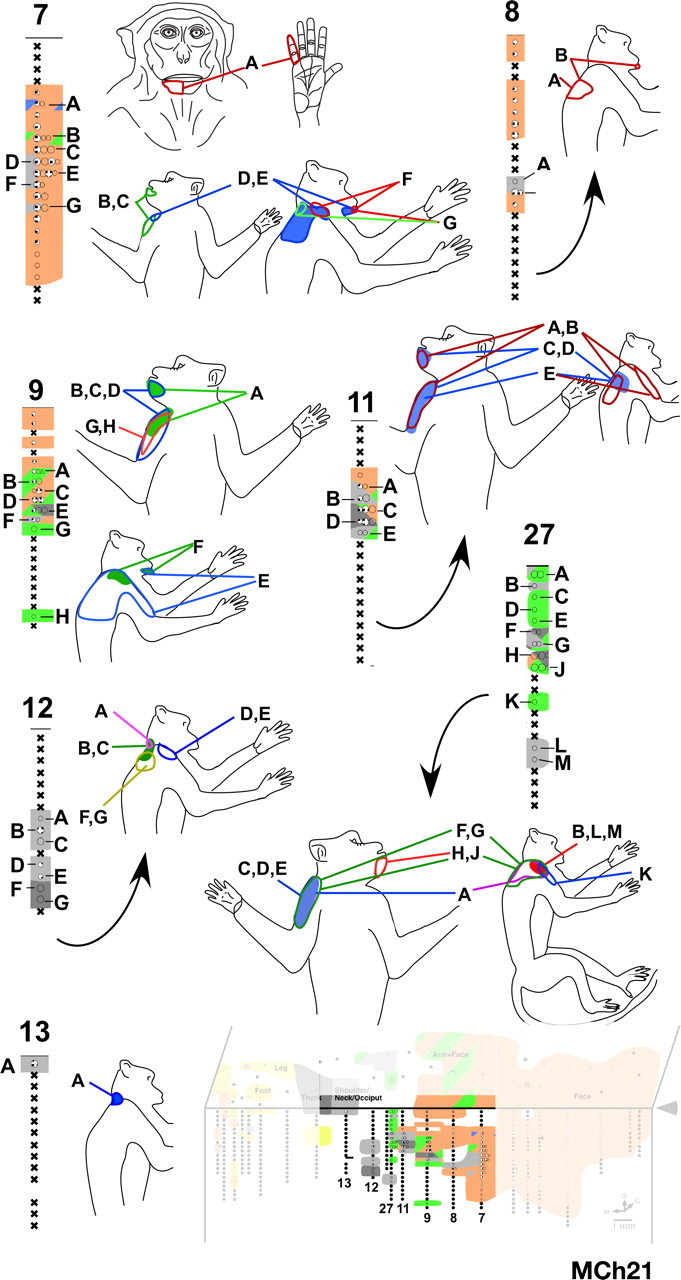
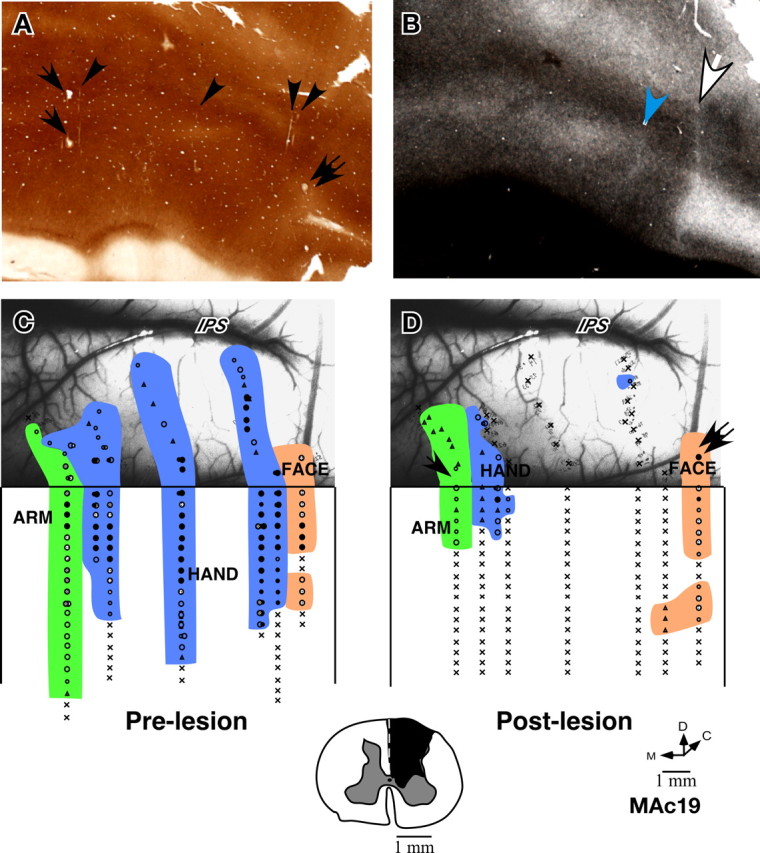
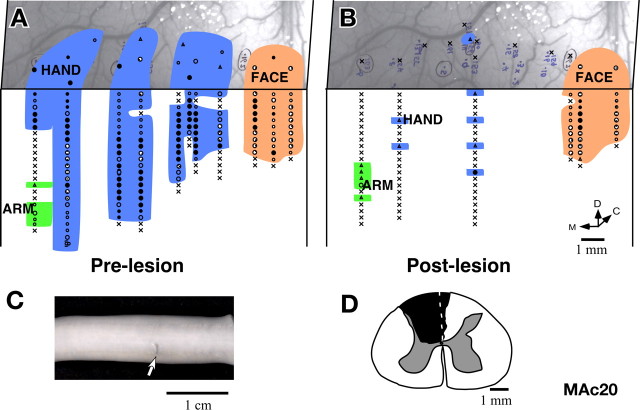
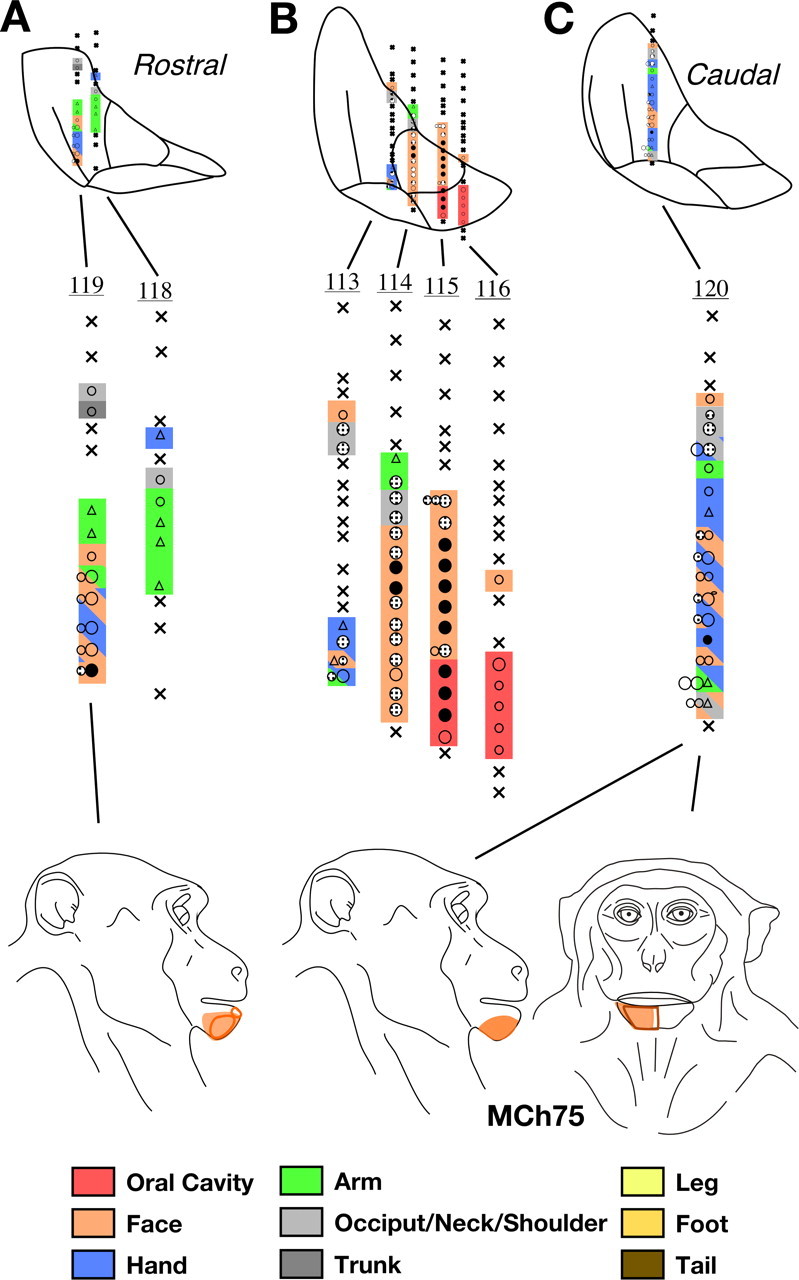
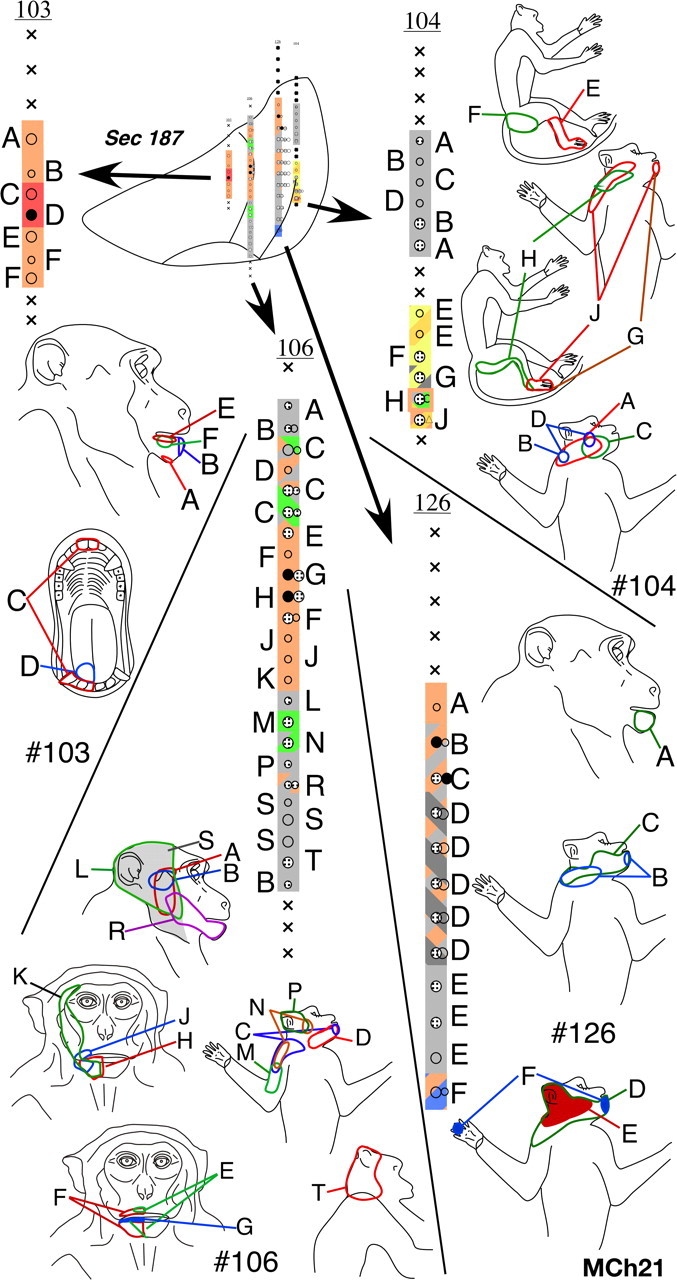
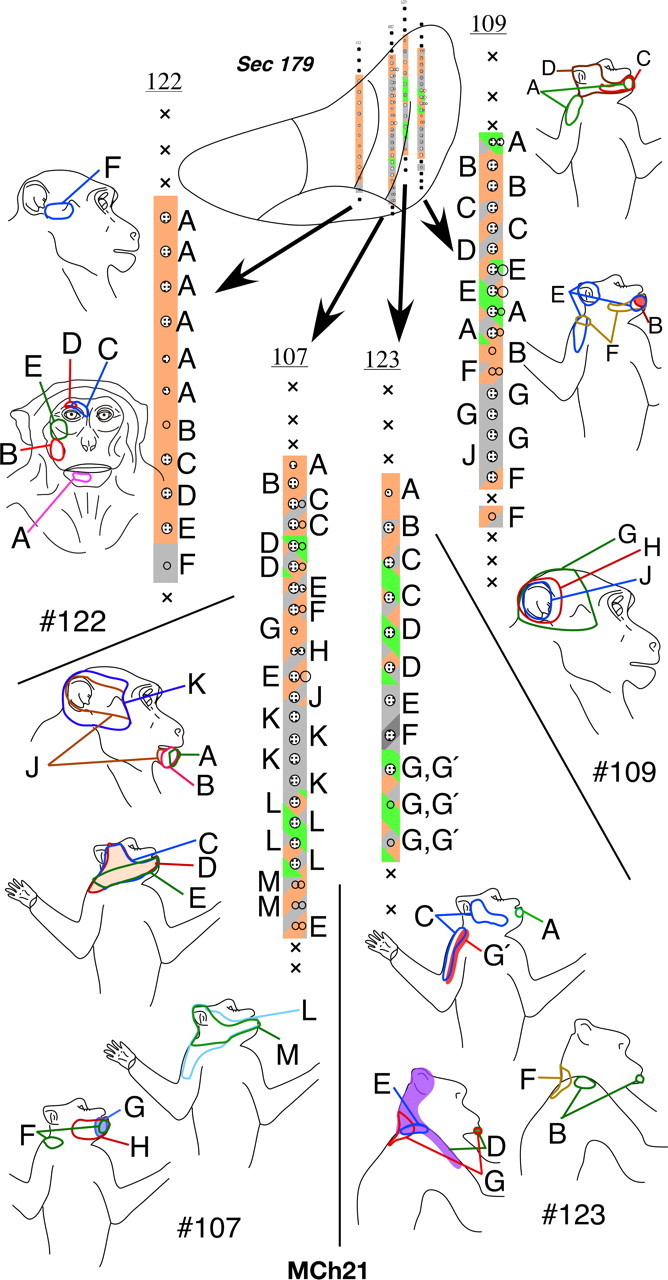
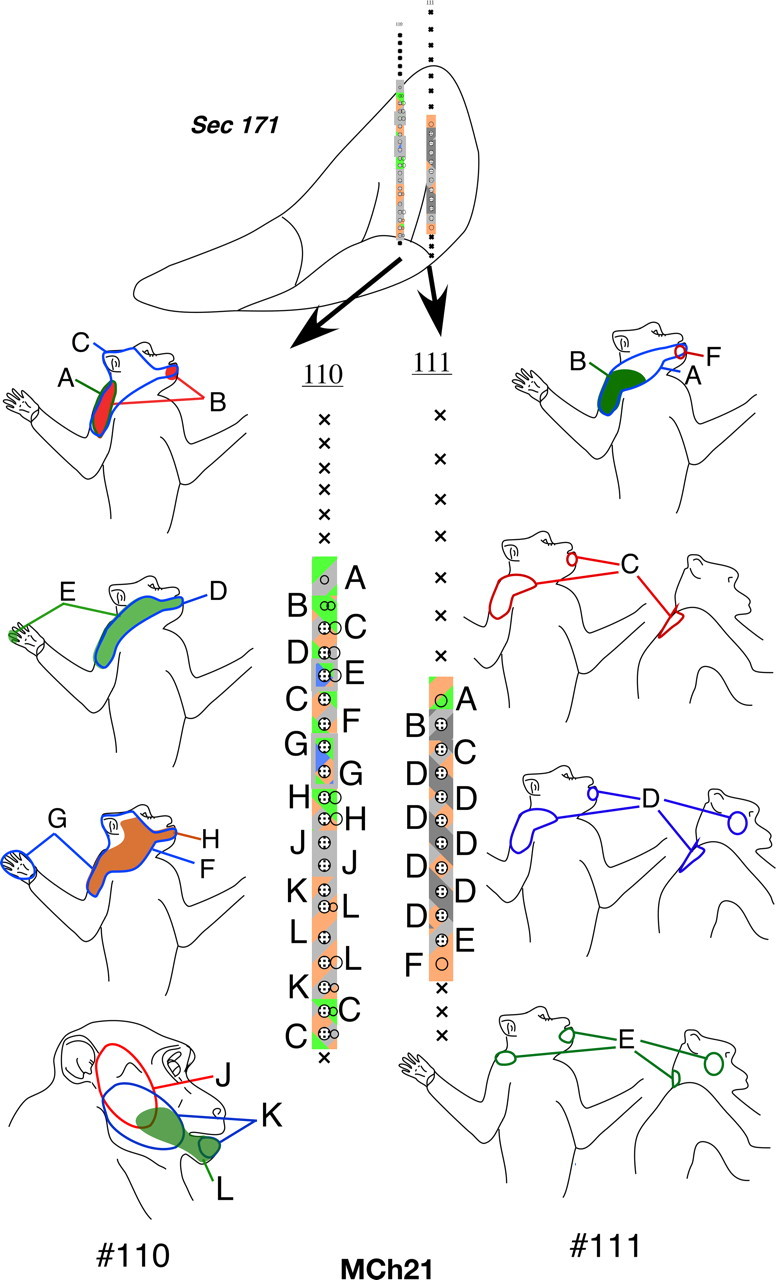
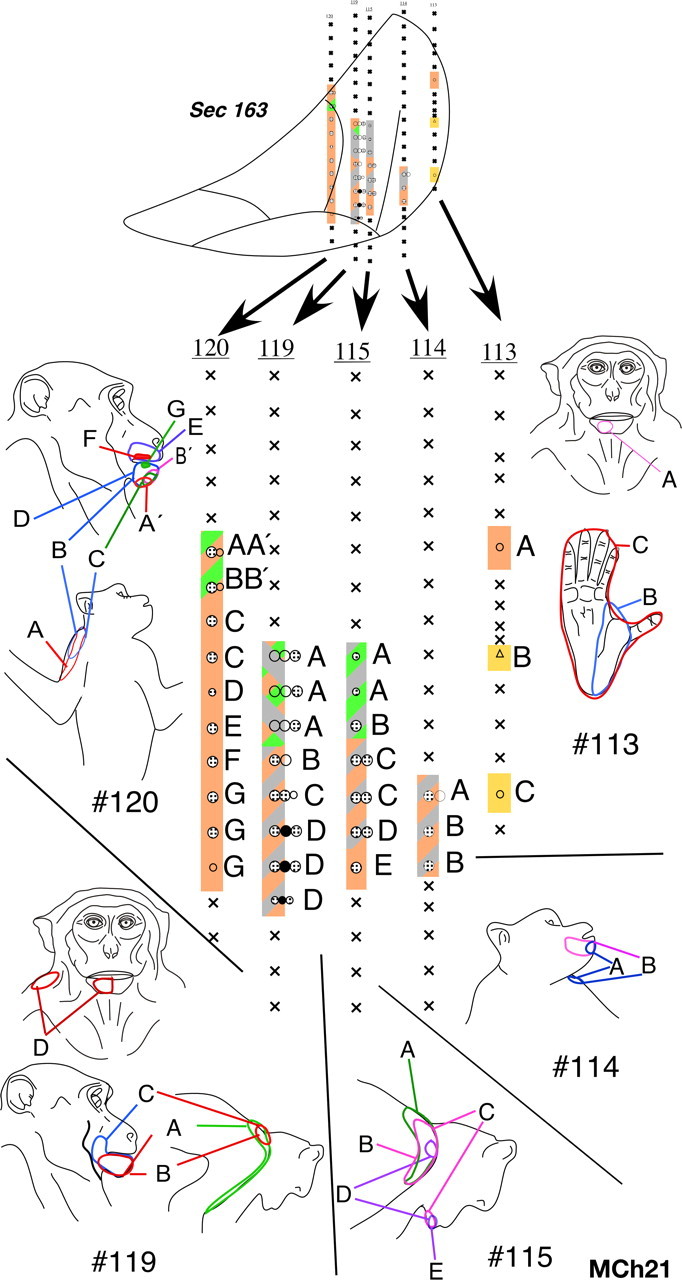
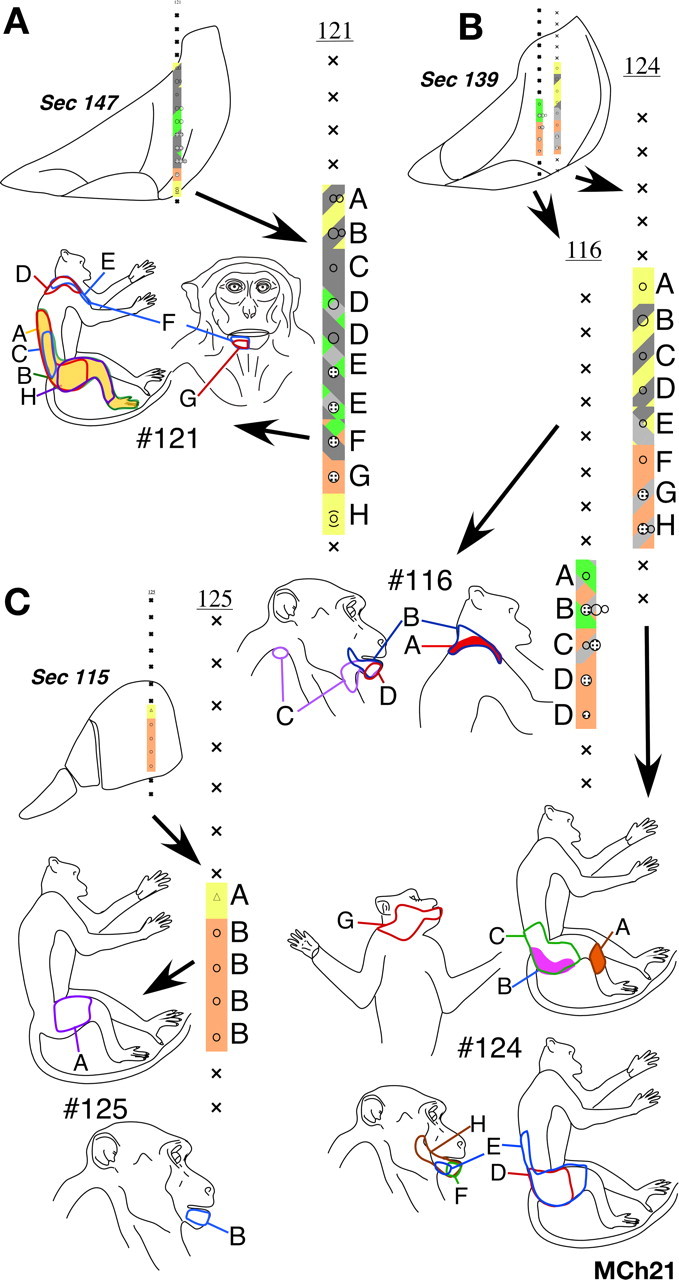
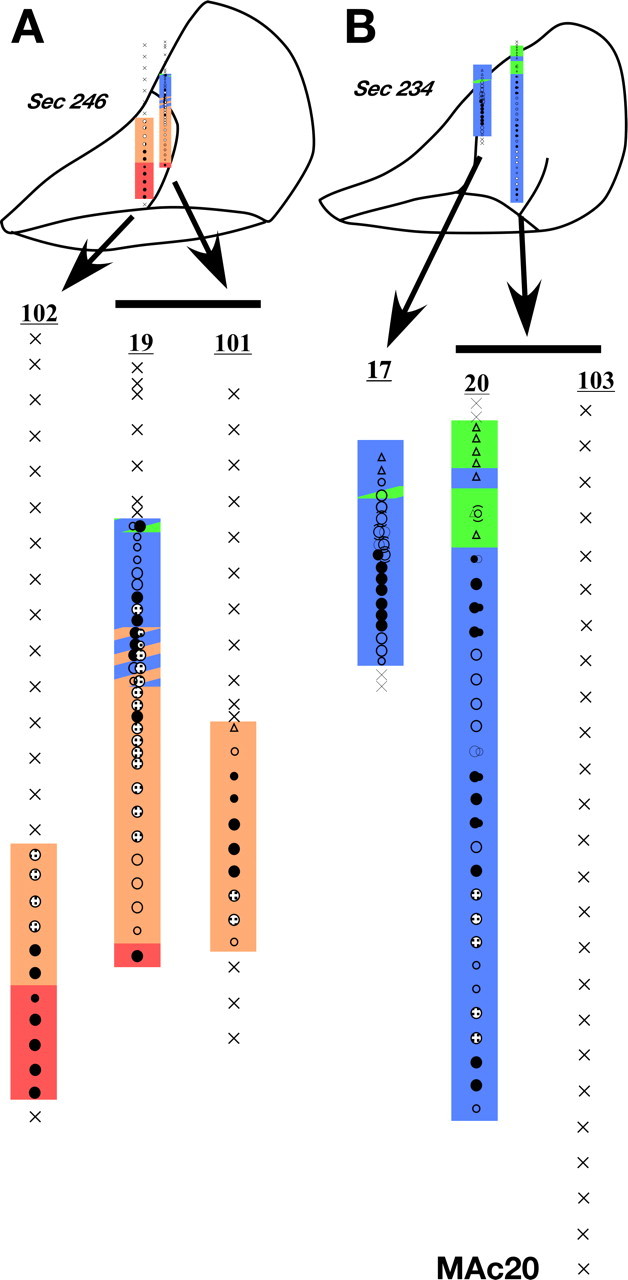
Adult brains undergo large-scale plastic changes after peripheral and central injuries. Although it has been shown that both the cortical and thalamic representations can reorganize, uncertainties exist regarding the extent, nature, and time course of changes at each level. We have determined how cortical representations in the somatosensory area 3b and the ventroposterior (VP) nucleus of thalamus are affected by long standing unilateral dorsal column lesions at cervical levels in macaque monkeys. In monkeys with recovery periods of 22-23 months, the intact face inputs expanded into the deafferented hand region of area 3b after complete or partial lesions of the dorsal columns. The expansion of the face region could extend all the way medially into the leg and foot representations. In the same monkeys, similar expansions of the face representation take place in the VP nucleus of the thalamus, indicating that both these processing levels undergo similar reorganizations. The receptive fields of the expanded representations were similar in somatosensory cortex and thalamus. In two monkeys, we determined the extent of the brain reorganization immediately after dorsal column lesions. In these monkeys, the deafferented regions of area 3b and the VP nucleus became unresponsive to the peripheral touch immediately after the lesion. No reorganization was seen in the cortex or the VP nucleus. A comparison of the extents of deafferentation across the monkeys shows that even if the dorsal column lesion is partial, preserving most of the hand representation, it is sufficient to induce an expansion of the face representation.


Figures

Figure 1.
Figure 1.
Location of area 3b in a macaque monkey brain (left) and outline of the somatotopy (right) in area 3b. Area 3b is located in the posterior bank of the central sulcus (CS). Inputs from the body surface are mapped in area 3b in a somatotopic order with the face inputs located laterally and the hand, arm occiput/neck/shoulder, trunk leg and foot progressively medially. Part of the foot and leg region is located on the medial wall of the cerebral hemisphere (data not shown). The hand–face border (white arrow) lies at a location near the tip of the intraparietal sulcus. Some of the features of the somatotopy such as the hand–face border and the interdigital borders can be visualized histologically in the brain sections stained for myelin (Figs. 5, 11, 15). The figure shown on the left is adapted from Nelson et al. (1980). IPS, Intraparietal sulcus; Occi, occiput; Shldr, shoulder; D1, D2, etc., digit 1, digit 2, etc.; P, palm; R, rostral; M, medial.
Figure 2.
Figure 2.
A, A photomicrograph showing a fluorescent electrode track in a section of the cortex cut tangentially to the surface through area 3b of monkey MCh73. The electrode was dipped in DiI before making the penetration. B, A “continuous” electrolytic lesion (see Materials and Methods) marking the electrode track (black arrow) in area 3b of the posterior bank of the central sulcus of monkey MCh21 and a focal lesion (white arrow). The section of the cortex was cut in a plane perpendicular to the central sulcus and stained for cytochrome oxidase. C, An example of recording sites along the electrode tract of the section shown in B (black arrow). For legend to the symbols, see legend to Figure 4 A. Scale bars: A, 500 μm; C, 1 mm.
Figure 3.
Figure 3.
A–C, Coronal sections of the thalamus through the VP nucleus of monkey MCh75 (A, B) and MCh21 (C) showing electrolytic lesions (arrows) made to help align microelectrode recording results with histological features revealed in sections stained for cytochrome oxidase activity (A) or Nissl substance (B, C). D, Outline of the VP nucleus showing normal somatotopy. Note the lines separating the representations of major body parts can be seen as CO light septa in A and cell sparse septa in B and C. Fa, Face; H, hand; F, foot; T, tail; VPMpc, parvicellular subdivision of the VP nucleus; VPI, ventroposterior inferior nucleus. The tail subnucleus is not apparent in the section shown in B. Scale bar (in A for A, B, C), 1 mm.
Figure 4.
Figure 4.
A, Somatotopy in left area 3b and the adjacent area 1 in monkey MCh75. The border marked by the white arrow is the normal hand–face border revealed in sections of the flattened cortex stained for myelin (Fig. 5). Note the expansion of the face and the arm responsive regions into the deafferented hand area. The black arrow on the right marks the line drawn at 1000 μm from the surface. The recording sites below the line are on the posterior bank of the central sulcus, and the sites above the line are on the dorsal surface of the postcentral gyrus. Regions devoted to different body surfaces are color-coded. In the striped regions, neurons responded to two or more body parts as per the color codes. The arrowheads mark the position of penetrations for which the receptive fields are shown in Figure 7. Black circles indicate sites with response to light cutaneous touch on the skin, dotted circles with responses to hairs, open circles with responses to taps. Larger circles indicate better responses and smaller circles weaker responses. Triangles mark the sites with weak responses to hard taps, making it difficult to define the receptive field with certainty. Multiple dots indicate sites with multiple or split receptive fields. The crosses mark the sites where neurons did not respond to any stimulation. Stars mark the sites where electrolytic lesions were made. D, Dorsal; M, medial; C, caudal. B, Reconstruction of the spinal cord lesion (black) on a coronal section. There was some sparing in the medio-dorsal region corresponding to the location of the fasciculus gracilis. C, Location of the lesion (arrow) shown on the outline diagram of the spinal cord. Rostral is to the left. C3, etc., denote the cervical roots and T1 is the first thoracic root.
Figure 5.
Figure 5.
Photomicrograph of a section of the flattened cortex of monkey MCh75 stained for myelin. The section was cut parallel to the pial surface. The myelin-light septum (arrow) marking the hand–face border is clearly visible. Left and right dotted lines respectively mark the fundus and the lip of the posterior bank of the central sulcus. R, Rostral; M, medial. Scale bar, 2 mm.
Figure 6.
Figure 6.
Locations of all the receptive fields on the face that were recorded for neurons in the reorganized cortex medial to the normal hand–face border in monkey MCh75 (Fig. 4 A). Note that all the receptive fields were confined to the chin except for a few that extended to the posterior jaw and neck.
Figure 7.
Figure 7.
Receptive fields of neurons in two penetrations through the posterior bank of the central sulcus in monkey MCh75. The penetrations illustrated here correspond to those marked by the black and the open arrowheads in Figure 4 and use the same color codes. The receptive fields of neurons at the sites marked by letters are shown on the figurines on the left. Note that at many sites the receptive fields split with responses elicited by touch on the hand/arm as well as chin. The receptive fields on the hand are large, often extending over multiple digits, unlike those in normal animals. For other conventions, see legend to Figure 4 A.
Figure 8.
Figure 8.
The organization of the hand representation in monkey MCh75. No clear somatotopy with distinct borders between digits was found although a lateral to medial D1–D3 trend was present. The white arrow marks the position of the septum that demarcates the hand–face border (Fig. 5). The arrowheads mark the penetrations for which detailed receptive fields are shown in Figure 7. Other conventions are as for Figure 4 A.
Figure 9.
Figure 9.
A, Somatotopy in right area 3b and the bordering cortex in monkey MCh73. The border marked by the white arrow is the normal hand–face border revealed in sections of the flattened cortex stained for myelin (Fig. 11). Note the expansion of the face-responsive regions into the deafferented hand area. The figure shown is as if from the left hemisphere for ease of comparison with other monkeys. For other conventions, see Figure 4 A. B, Reconstruction of the spinal cord lesion in a coronal section (region shown in black). C, Location of the lesion (arrow) on a diagram of the spinal cord. Rostral is to the left. C3, etc., denote the cervical roots, and T1, etc., are the thoracic roots.
Figure 10.
Figure 10.
A, Locations of all the receptive fields on the face that were found in the normal face region lateral to the hand–face border in monkey MCh73 (Fig. 9 A). Note that the receptive fields are located all over the face. B, Locations of all the receptive fields on the face that were found in the reorganized cortex, medial to the hand–face border in monkey MCh75 (Fig. 9 A). Note that all the receptive fields are confined to the chin.
Figure 11.
Figure 11.
A, A myelin-stained section through area 3b of the flattened cortex of monkey MCh73 cut parallel to the pial surface to reveal the hand–face border (white arrow) and the borders between digit 1–digit 2 and digit 2–digit 3 (blue arrowheads). B, Somatotopy of the hand in monkey MCh73. Although the progression of receptive fields in the lateral part (D1, D2, and radial palm) was normal, the medial part had no clear somatotopy and no clear borders between the representations of D4 and D5 digits. Conventions as for Figure 4 A. C, Representative receptive fields on digit 1, digit 2, and radial palm for monkey MCh73. Note that the receptive fields are small as for a normal monkey. D, Representative receptive fields on digit 4, digit 5, and ulnar palm for the same monkey. The receptive fields are large covering an entire digit or multiple digits.
Figure 12.
Figure 12.
A, Somatotopy in the left area 3b and the bordering cortex in monkey MCh21. The white arrow on the top marks the expected location of the normal hand–face border as estimated from the location of the tip of the intraparietal sulcus (Fig. 15). Note the expansion of the face responsive regions into the deafferented hand, arm and occiput areas. Receptive fields on the face were also seen in the medial most region intermingled with the leg and the foot representations. Conventions as for Figure 4 A. B, Reconstruction of the spinal cord lesion on a coronal section (region shown in black). C, Location of the lesion (arrow) on a dorsal view of the spinal cord. Rostral is to the left.
Figure 13.
Figure 13.
A, Locations of all the receptive fields on the face for monkey MCh21 that were observed in the normal face region lateral to the hand–face border. This region is marked as region A′ in the inset shown at the bottom (see Fig. 12 A). The receptive fields are located all over the face as in a normal monkey. B, Locations of all the receptive fields on the face that were found in the reorganized cortex medial to the hand–face border and lateral to the trunk representation marked as region B′ inset shown at the bottom. Note that the receptive fields at all the recording sites are confined to the chin except for one receptive field that extends to the upper lip. C, Locations of all the receptive fields on the face that were found in the reorganized cortex medial to the trunk representation marked as region C′ inset shown at the bottom. The receptive fields at all the recording sites were confined to the chin as for the region B′.
Figure 14.
Figure 14.
Receptive fields of neurons in penetrations through area 3b in the region where in addition to receptive fields on the chin we encountered neurons with responses to touch on the hand, arm, or occiput. The receptive fields of neurons in each penetration at the sites marked by letters are shown on the adjacent figurines. Note that the receptive fields on the arm were confined to the anterior upper arm. Only at one site (site “A” in penetration 7) did neurons respond to touch on the hand (digit 5). The locations of the electrode penetrations are shown on the inset on the bottom right (compare Fig. 12 A).
Figure 15.
Figure 15.
Somatotopy in area 3b of monkey MAc19 before and immediately after lesion of the dorsal columns. A, Cytochrome oxidase-stained section of the flattened cortex through area 3b showing electrolytic microlesions made during the experiment (arrows and double arrow) and some visible electrode tracks (arrowheads). B, A myelin-stained section of the flattened cortex showing the hand–face border (white arrow) and the border between D1 and D2 (blue arrowhead). C, Locations of neurons with receptive fields on the face, hand and arm encountered in area 3b and the adjacent cortex before lesion of the dorsal columns of the spinal cord, and (D) immediately after lesion of the contralateral dorsal columns of the spinal cord. Only a few neurons responded to the taps on the hand or arm perhaps because of sparing of some of the dorsal column fibers. The arrow and the double arrow shown in D indicate the penetrations marked with electrolytic lesions (compare with A). The photograph underlay in C and D shows the correspondence of the prelesion and postlesion penetration sites with respect to the surface vasculature of the brain. Intraparietal sulcus (IPS) is visible at the top of the photograph. Note that the hand–face border is located near the end of the IPS, our basis for interpretation of this border for monkey MCh21. Inset at the bottom shows the spinal cord lesion reconstructed from the transverse sections of the spinal cord. Conventions as for Figure 4 A.
Figure 16.
Figure 16.
Somatotopy in area 3b of monkey MAc20 before and immediately after lesion of the dorsal columns. A, Locations of neurons with receptive fields on the face, hand and arm encountered in area 3b and adjacent cortex before, and (B) immediately after lesion of the contralateral dorsal columns of the spinal cord. After lesion, only a few neurons responded weakly to hard taps on the hand or arm. The photograph underlay in A and B shows the correspondence of the prelesion and postlesion penetration sites with respect to the surface vasculature of the brain. C, Photograph showing lesion (arrow) on the dorsal surface of the spinal cord. Rostral is to the left. D, The lesion reconstructed from the transverse sections of the spinal cord.
Figure 17.
Figure 17.
A, B, C, Somatotopy and receptive fields encountered in seven electrode penetrations through the VP nucleus of monkey MCh75 shown on a series of three rostral to caudal coronal sections. The figurines at the bottom show abnormally located receptive fields on the face for neurons in the lateral portion of VP. Normally located receptive fields, i.e., those on the face in VPM, and other body parts in VPL are not shown. For illustration purposes, electrode penetrations within a rostrocaudal extent of 500 μm are projected on a single intermediate section. The penetrations are numbered. The color key shown at the bottom also applies to the maps shown in Figures 18 –23 and is same as used for illustrating maps of area 3b. The regions shown in double or triple colors by use of colored slanting lines indicate mapping sites where neurons had multiple receptive fields on body parts indicated by the colors of the lines. For other conventions, see Figure 4 A.
Figure 18.
Figure 18.
Somatotopy and receptive fields encountered in electrode penetrations through the ventroposterior nucleus of monkey MCh21 shown on a series of caudal to rostral sections in Figures 18 –22. Penetrations within a rostrocaudal extent of 500 μm are projected on a single intermediate section. Conventions as for Figures 4 A and 17.
Figure 19.
Figure 19.
Please see legend to Figure 18.
Figure 20.
Figure 20.
Please see legend to Figure 18.
Figure 21.
Figure 21.
Please see legend to Figure 18.
Figure 22.
Figure 22.
Please see legend to Figure 18.
Figure 23.
Figure 23.
A, B, Somatotopy in electrode penetrations through the ventroposterior nucleus of monkey MAc20 before and immediately after dorsal column lesion. A, Is a more rostral section compared with B. Penetration #19 and #20 are prelesion penetrations although #102, #101, and #103 were made after lesion. Penetration #101 was made at the same location as #19 and penetration #103 at the location of #20. Note the absence of receptive fields in the hand (blue) after the lesion. Penetrations within a rostrocaudal extent of 500 μm are projected on a single intermediate section. Conventions as for Figures 4 A and 17.

Similar articles

Cited by

References

    1. Calford MB, Tweedale R. Immediate and chronic changes in responses of somatosensory cortex in adult flying-fox after digit amputation. Nature. 1988;332:446–448. - PubMed
    1. Calford MB, Tweedale R. Immediate expansion of receptive fields of neurons in area 3b of macaque monkeys after digit denervation. Somatosens Mot Res. 1991;8:249–260. - PubMed
    1. Chen R, Cohen LG, Hallett M. Nervous system reorganization following injury. Neuroscience. 2002;111:761–773. - PubMed
    1. Condés-Lara M, Barrios FA, Romo JR, Rojas R, Salgado P, Sánchez-Cortazar J. Brain somatic representation of phantom and intact limb: a fMRI study case report. Eur J Pain. 2000;4:239–245. - PubMed
    1. Darian-Smith C, Brown S. Functional changes at periphery and cortex following dorsal root lesions in adult monkeys. Nat Neurosci. 2000;3:476–481. - PubMed

Publication types

MeSH terms

LinkOut - more resources