Quantitative assessment of serum and urinary polyclonal free light chains in patients with chronic kidney disease
- PMID: 18945993
- PMCID: PMC2572283
- DOI: 10.2215/CJN.02290508
Quantitative assessment of serum and urinary polyclonal free light chains in patients with chronic kidney disease
Abstract
Background and objectives: Monoclonal free light chains (FLC) frequently cause kidney disease in patients with plasma cell dyscrasias. Polyclonal FLC, however, have not been assessed in patients with chronic kidney disease (CKD) yet could potentially play an important pathologic role. This study describes for the first time polyclonal FLC in patients with CKD.
Design, setting, participants, & measurements: A sensitive, quantitative immunoassay was used to analyze serum and urinary polyclonal FLC in 688 patients with CKD of various causes.
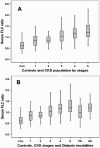
Results: Serum kappa and lambda FLC concentrations increased progressively with CKD stage (both P < 0.001) and strongly correlated with markers of renal function, including cystatin-C (kappa: R = 0.8, P < 0.01; and lambda: R = 0.79, P < 0.01). Urinary FLC concentrations varied significantly between disease groups (kappa: P < 0.001; lambda: P < 0.005) and also rose significantly with increasing CKD stage (both FLC P < 0.0001). Urinary FLC concentrations were positively correlated with their corresponding serum concentration (kappa: R = 0.63; lambda: R = 0.65; both P < 0.001) and urinary albumin creatinine ratio (kappa: R = 0.58; lambda: R = 0.65; both P < 0.001). The proportion of patients with abnormally high urinary FLC concentrations rose with both the CKD stage and the severity of albuminuria.
Conclusions: This study demonstrates significant abnormalities of serum and urinary polyclonal FLC in patients with CKD. These data provide the basis for studies that assess the contribution of polyclonal FLC to progressive renal injury and systemic inflammation in patients with kidney disease.
Figures


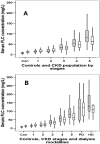
 ) and λ (□) FLC increased progressively with each CKD stage (both P < 0.0001). (B) Patients who required renal replacement therapy had serum FLC concentrations significantly higher than patients with stage 5 CKD (both P < 0.001). There were no significant differences in serum concentrations of FLC between the peritoneal dialysis (PD) and hemodialysis (HD) populations: κ, P < 0.09; λ, P < 0.5. Data presented as box plots with whiskers; solid lines denote median values.

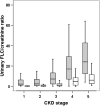
 ) and λ/creatinine ratio (LCR; □) increased progressively through each CKD stage; 1, 2.3 (0.3 to 21) and 0.25 (0.03 to 8.7); 2, 2.3 (0.11 to 31) and 0.39 (0.02 to 10); 3, 7.2 (0.1 to 126) and 1.23 (0.01 to 70); 4, 17 (0.22 to 123) and 4.55 (0 to 36.8); and 5, 24 (4.2 to 121) and 6.1 (0.78 to 77), respectively (both P < 0.0001). Data presented as box plots with whiskers; solid lines denote median values.
References
-
- Herrera GA: Renal manifestations of plasma cell dyscrasias: An appraisal from the patients’ bedside to the research laboratory. Ann Diagn Pathol 4: 174–200, 2000 - PubMed
-
- Montseny JJ, Kleinknecht D, Meyrier A, Vanhille P, Simon P, Pruna A, Eladari D: Long-term outcome according to renal histological lesions in 118 patients with monoclonal gammopathies. Nephrol Dial Transplant 13: 1438–1445, 1998 - PubMed
-
- Pote A, Zwizinski C, Simon EE, Meleg-Smith S, Batuman V: Cytotoxicity of myeloma light chains in cultured human kidney proximal tubule cells. Am J Kidney Dis 36: 735–744, 2000 - PubMed
-
- Bence Jones H: Papers on chemical pathology. Lancet 2: 88–92, 1847
Publication types
MeSH terms
Substances
Grants and funding
LinkOut - more resources
Full Text Sources
Other Literature Sources
Medical

