. 2008 Oct 28;105(43):16496-501.
doi: 10.1073/pnas.0802779105. Epub 2008 Oct 22.

Adaptive antioxidant methionine accumulation in respiratory chain complexes explains the use of a deviant genetic code in mitochondria

Affiliations

Adaptive antioxidant methionine accumulation in respiratory chain complexes explains the use of a deviant genetic code in mitochondria

Aline Bender et al. Proc Natl Acad Sci U S A. .

Abstract

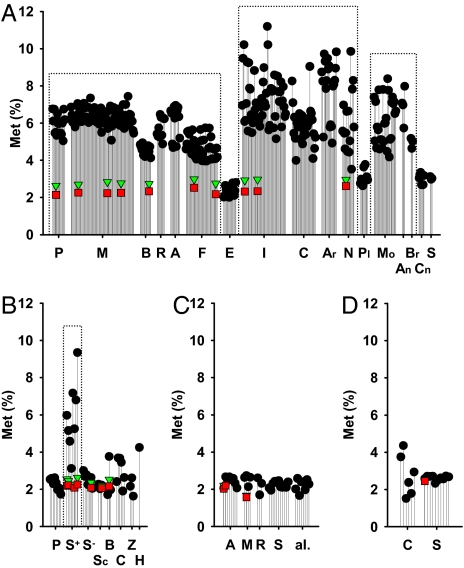
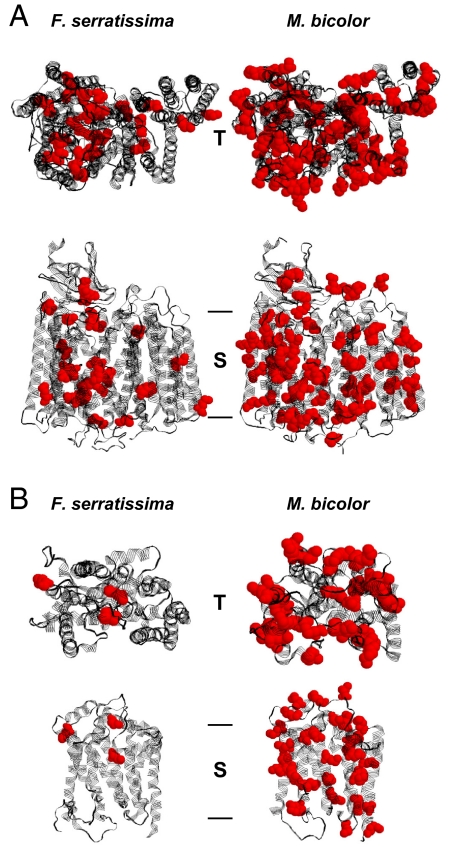
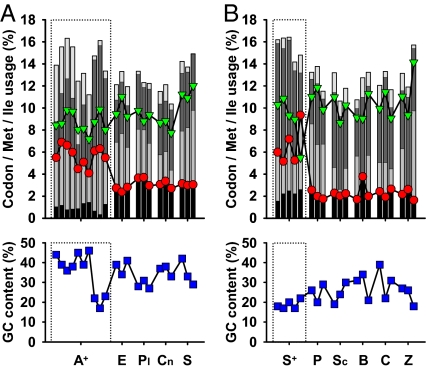
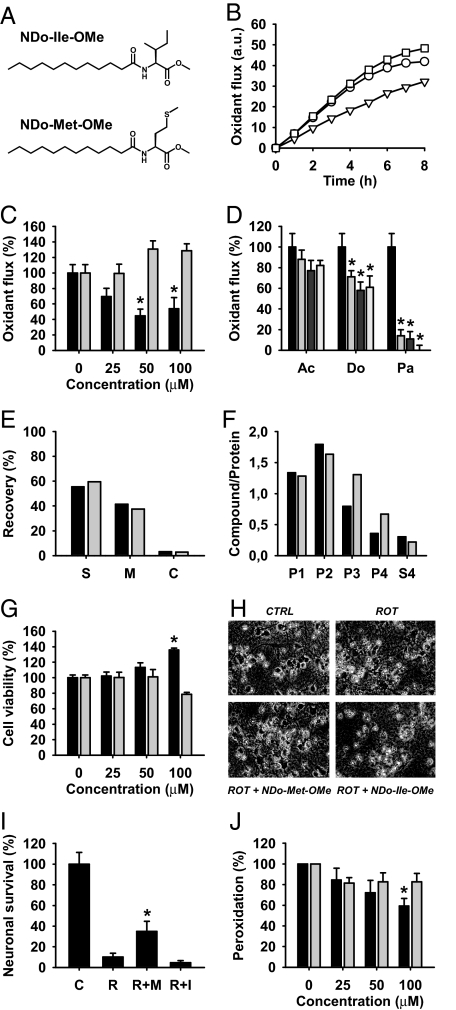
Humans and most other animals use 2 different genetic codes to translate their hereditary information: the standard code for nuclear-encoded proteins and a modern variant of this code in mitochondria. Despite the pivotal role of the genetic code for cell biology, the functional significance of the deviant mitochondrial code has remained enigmatic since its first description in 1979. Here, we show that profound and functionally beneficial alterations on the encoded protein level were causative for the AUA codon reassignment from isoleucine to methionine observed in most mitochondrial lineages. We demonstrate that this codon reassignment leads to a massive accumulation of the easily oxidized amino acid methionine in the highly oxidative inner mitochondrial membrane. This apparently paradoxical outcome can yet be smoothly settled if the antioxidant surface chemistry of methionine is taken into account, and we present direct experimental evidence that intramembrane accumulation of methionine exhibits antioxidant and cytoprotective properties in living cells. Our results unveil that methionine is an evolutionarily selected antioxidant building block of respiratory chain complexes. Collective protein alterations can thus constitute the selective advantage behind codon reassignments, which authenticates the "ambiguous decoding" hypothesis of genetic code evolution. Oxidative stress has shaped the mitochondrial genetic code.


Conflict of interest statement

The authors declare no conflict of interest.

Figures

Fig. 1.
Fig. 1.
Mitochondrially encoded methionine contents in 361 animal species, 39 fungi, 34 unicellular eukaryotes, and 16 plants, compared with a reference selection of nuclear-encoded, proteomic methionine contents. (A) Methionine contents of mitochondrially encoded proteomes of 361 animal species (black circles). P, primates; M, other mammals; B, birds; R, reptiles; A, amphibians; F, fish; E, echinoderms; I, insects; C, crustaceans; Ar, arachnids; N, nematodes; Pl, platyhelminthes; Mo, molluscs; An, annelids; Br, brachiopods; Cn, cnidarians; S, sponges. Genomically encoded methionine contents of 10 reference species are shown for comparison (red squares). Adjustment of these nuclear-encoded proteomes to the higher transmembrane domain contents of the belonging mitochondrially encoded proteomes led to only marginally higher reference values (green triangles). The 10 reference species were (from left to right): Homo sapiens, Bos taurus, Mus musculus, Rattus norvegicus, Gallus gallus, Danio rerio, Tetraodon nigroviridis, Anopheles gambiae, Drosophila melanogaster, Caenorhabditis elegans. Clades, which use 2 codons (AUG and AUA) to encode mitochondrial methionine are marked by dotted frames. (B) Mitochondrially encoded methionine contents in 39 fungi. Symbols and frames are used as in A. P, pezizomycotina; S+, saccharomycotina, which decode AUA as methionine; S, saccharomycotina, which decode AUA as isoleucine; Sc, schizosaccharomycetes; B, basidiomycota; C, chytridiomycota; Z, zygomycota; H, Hyaloraphidium curvatum. The 7 reference species were: Ashbya gossypii, Candida glabrata, Saccharomyces cerevisiae, Yarrowia lipolytica, Kluyveromyces lactis, Schizosaccharomyces pombe, Cryptococcus neoformans. (C) Mitochondrially encoded methionine contents in 34 unicellular eukaryotes. Symbols are used as in A. A, alveolata; M, mycetozoa; R, rhodophyta; S, stramenopiles; al., other eukaryotes. The 3 reference species were: Paramecium tetraurelia, Plasmodium falciparum, Dictyostelium discoideum. (D) Mitochondrially encoded methionine contents in 16 plants. Symbols are used as in A. C, chlorophyta; S, streptophyta. The reference species was Arabidopsis thaliana. All species names and calculated numeric values pertaining to this figure are given in Table S1.
Fig. 2.
Fig. 2.
Structural models of mitochondrially encoded respiratory chain proteins from the feather star Florometra serratissima and the stingless bee Melipona bicolor. (A) COX core, consisting of COX subunits I, II, and III. COX core is the central part of respiratory chain complex IV. (B) Cytochrome b, the mitochondrially encoded core peptide of ubiquinone-cytochrome c oxidoreductase (respiratory chain complex III). The top view representations (T) approximate the perspective from the mitochondrial intermembrane space. The side view representations (S) show the identical structures as beheld from within the inner mitochondrial membrane, placing the intermembrane space on top. Methionine residues are shown in red. Bars indicate the approximate membrane boundaries. A distinct accumulation of methionine can be discerned in the insect enzymes. The displayed structures correspond to the following methionine contents: COX core: 2.9% in F. serratissima, 7.8% in M. bicolor; cytochrome b: 1.1% in F. serratissima, 9.5% in M. bicolor. Mitochondrially encoded NADH dehydrogenase subunits of M. bicolor exhibited an even more pronounced methionine accumulation, reaching approximately double the level (13.5%) of the displayed COX core structure.
Fig. 3.
Fig. 3.
Animal and fungal codon usage in relation to the mitochondrial AUA codon reassignment. (A) Methionine content (red circles), isoleucine content (green triangles), codon usage (bars, from bottom to top: AUG, AUA, AUU, AUC), and GC content (blue squares, Lower) in a representative selection of animals, which decode AUA as methionine (the 10 reference species from Fig. 1A, marked by dotted frames), vs. 3 representatives from each phylum decoding AUA as isoleucine. These representatives were selected based on the total number of protein sequences known for each species. A+, animals, which decode AUA as methionine; E, echinoderms; Pl, platyhelminthes; Cn, cnidarians; S, sponges. (B) The same data as in A, pertaining to fungi. Four reference species from Fig. 1B (A. gossypii, C. glabrata, S. cerevisiae, Y. lipolytica) plus Saccharomyces castellii, all decoding AUA as methionine and marked by dotted frames, compared with 3 representatives from each fungal clade decoding AUA as isoleucine. The latter representatives were selected on the same grounds as in A. S+, saccharomycotina, which decode AUA as methionine; P, pezizomycotina; Sc, schizosaccharomycetes; B, basidiomycota; C, chytridiomycota; Z, zygomycota.
Fig. 4.
Fig. 4.
Antioxidant and cytoprotective effects of intramembrane methionyl accumulation. (A) Chemical structures of 2 model compounds used to mimic the cellular effect of the AUA codon reassignment in mitochondria. The 2 structures are N-dodecanoyl methionine methyl ester (NDo-Met-OMe) and N-dodecanoyl isoleucine methyl ester (NDo-Ile-OMe). (B) Metabolic oxidant flux in respiring SH-SY5Y neuroblastoma cells as measured by the temporal increase in cellular DCF fluorescence. Treatments were vehicle (circles), 50 μM NDo-Ile-OMe (squares), and 50 μM NDo-Met-OMe (triangles). (C) Induced oxidant flux in SH-SY5Y cells after addition of hydrogen peroxide (H2O2; 500 μM). Shown are normalized increases in cellular DCFA fluorescence 1 h after application of the peroxide. Black bars represent NDo-Met-OMe, gray bars represent NDo-Ile-OMe. (D) Comparison of N-acylated methionine derivatives as oxidant quenchers in SH-SY5Y cells. Experiments were done as in C; measurements were done after 3 h of incubation with H2O2. Ac is N-acetyl methionine methyl ester, Do is N-dodecanoyl methionine methyl ester, Pa is N-palmitoyl methionine. Each stack of bars represents concentrations of 0, 25, 50, 100 μM of the corresponding compound from left to right. (E) Cell permeability and membrane accumulation of NDo-Met-OMe (black bars) and NDo-Ile-OMe (gray bars), analyzed by HPLC with fluorescence detection. SH-SY5Y cells were treated with both compounds (100 μM) as in C, after which the different compartments were separated by centrifugation. (S) supernatant (incubation medium); M, membrane fraction; C, cytosolic fraction. Data are presented as relative recovery of each applied compound. (F) Subcellular distribution of NDo-Met-OMe (black bars) and NDo-Ile-OMe (gray bars) in SH-SY5Y cells. Organelle-enriched fractions were prepared after 1-h incubation (100 μM concentration) as in C. P1, nuclear fraction; P2, mitochondrial fraction; P3, Golgi fraction; P4, endoplasmic reticulum fraction; S4, cytosolic fraction. (G) Primary mesencephalic cell culture survival under hyperoxic culture conditions (20% oxygen). Metabolic MTT reduction was measured in mature cultures after a differential incubation with NDo-Met-OMe vs. NDo-Ile-OMe for 3 d. (H) Micrographs of primary mesencephalic cells incubated with rotenone (50 nM) and the indicated amino acid derivatives (100 μM) for 3 d. (I) The same experiment as in H, quantified by microscopic evaluation of neuronal survival. (J) Lipid peroxidation in rat liver mitochondria (1 mg/ml protein), induced by 10-min incubation with 200 μM Fe2+/100 μM H2O2. Mitochondria were preincubated with the compounds to be tested for 30 min. TBARS formation was measured by fluorimetric assay. Black bars represent NDo-Met-OMe, gray bars represent NDo-Ile-OMe. Numeric results are given as mean ± standard deviation. Asterisks denote significantly decreased oxidant flux (C and D), significantly increased cellular survival (G and I), or significantly decreased lipid peroxidation (J) as compared with the control (n ≥ 3; P < 0.01 by ANOVA with Student–Newman–Keul's test).

References

    1. Barrell BG, Bankier AT, Drouin J. A different genetic code in human mitochondria. Nature. 1979;282:189–194. - PubMed
    1. Knight RD, Freeland SJ, Landweber LF. Rewiring the keyboard: Evolvability of the genetic code. Nat Rev Genet. 2001;2:49–58. - PubMed
    1. Santos MA, Moura G, Massey SE, Tuite MF. Driving change: The evolution of alternative genetic codes. Trends Genet. 2004;20:95–102. - PubMed
    1. Osawa S, Jukes TH, Watanabe K, Muto A. Recent evidence for evolution of the genetic code. Microbiol Rev. 1992;56:229–264. - PMC - PubMed
    1. Crick FH. The origin of the genetic code. J Mol Biol. 1968;38:367–379. - PubMed

Publication types