

Accuracy and anatomical coverage of perfusion CT assessment of the blood-brain barrier permeability: one bolus versus two boluses
- PMID: 18946215
- PMCID: PMC2914360
- DOI: 10.1159/000165113
Accuracy and anatomical coverage of perfusion CT assessment of the blood-brain barrier permeability: one bolus versus two boluses
Abstract
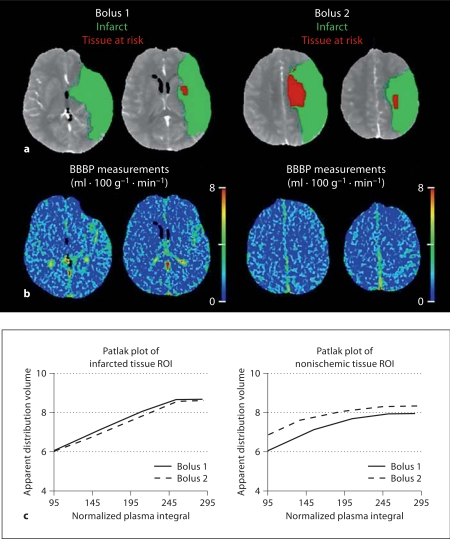
Purpose: To assess whether blood-brain barrier permeability (BBBP) values, extracted with the Patlak model from the second perfusion CT (PCT) contrast bolus, are significantly lower than the values extracted from the first bolus in the same patient.
Materials and methods: 125 consecutive patients (29 with acute hemispheric stroke and 96 without stroke) who underwent a PCT study using a prolonged acquisition time up to 3 min were retrospectively identified. The Patlak model was applied to calculate the rate of contrast leakage out of the vascular compartment. Patlak plots were created from the arterial and parenchymal time enhancement curves obtained in multiple regions of interest drawn in ischemic brain tissue and in nonischemic brain tissue. The slope of a regression line fit to the Patlak plot was used as an indicator of BBBP. Square roots of the mean squared errors and correlation coefficients were used to describe the quality of the linear regression model. This was performed separately for the first and the second PCT bolus. Results from the first and the second bolus were compared in terms of BBBP values and the quality of the linear model fitted to the Patlak plot, using generalized estimating equations with robust variance estimation.
Results: BBBP values from the second bolus were not lower than BBBP values from the first bolus in either nonischemic brain tissue [estimated mean with 95% confidence interval: 1.42 (1.10-1.82) ml x 100 g(-1) x min(-1) for the first bolus versus 1.64 (1.31-2.05) ml x 100 g(-1) x min(-1) for the second bolus, p = 1.00] or in ischemic tissue [1.04 (0.97-1.12) ml x 100 g(-1) x min(-1) for the first bolus versus 1.19 (1.11-1.28) ml x 100 g(-1)min(-1) for the second bolus, p = 0.79]. Compared to regression models from the first bolus, the Patlak regression models obtained from the second bolus were of similar or slightly better quality. This was true both in nonischemic and ischemic brain tissue.
Conclusion: The contrast material from the first bolus of contrast for PCT does not negatively influence measurements of BBBP values from the second bolus. The second bolus can thus be used to increase anatomical coverage of BBBP assessment using PCT.
2008 S. Karger AG, Basel.
Figures
Similar articles
-
Optimal duration of acquisition for dynamic perfusion CT assessment of blood-brain barrier permeability using the Patlak model.AJNR Am J Neuroradiol. 2009 Aug;30(7):1366-70. doi: 10.3174/ajnr.A1592. Epub 2009 Apr 15. AJNR Am J Neuroradiol. 2009. PMID: 19369610 Free PMC article.
-
Dynamic perfusion CT assessment of the blood-brain barrier permeability: first pass versus delayed acquisition.AJNR Am J Neuroradiol. 2008 Oct;29(9):1671-6. doi: 10.3174/ajnr.A1203. Epub 2008 Jul 17. AJNR Am J Neuroradiol. 2008. PMID: 18635616 Free PMC article.
-
Dynamic perfusion-CT assessment of early changes in blood brain barrier permeability of acute ischaemic stroke patients.J Neuroradiol. 2011 Jul;38(3):161-6. doi: 10.1016/j.neurad.2010.08.001. Epub 2010 Oct 14. J Neuroradiol. 2011. PMID: 20950860
-
[Cerebral perfusion CT: theoretical aspects, methodical implementation and clinical experience in the diagnosis of ischemic cerebral infarction].Rofo. 2000 Mar;172(3):210-8. doi: 10.1055/s-2000-109. Rofo. 2000. PMID: 10778450 Review. German.
-
Acute stroke: perfusion imaging.Front Neurol Neurosci. 2006;21:127-139. doi: 10.1159/000092395. Front Neurol Neurosci. 2006. PMID: 17290132 Review.
Cited by
-
Validation of in vivo magnetic resonance imaging blood-brain barrier permeability measurements by comparison with gold standard histology.Stroke. 2011 Jul;42(7):2054-60. doi: 10.1161/STROKEAHA.110.597997. Epub 2011 Jun 2. Stroke. 2011. PMID: 21636816 Free PMC article.
-
Blood-brain barrier permeability assessed by perfusion CT predicts symptomatic hemorrhagic transformation and malignant edema in acute ischemic stroke.AJNR Am J Neuroradiol. 2011 Jan;32(1):41-8. doi: 10.3174/ajnr.A2244. Epub 2010 Oct 14. AJNR Am J Neuroradiol. 2011. PMID: 20947643 Free PMC article.
-
Delay correction for the assessment of blood-brain barrier permeability using first-pass dynamic perfusion CT.AJNR Am J Neuroradiol. 2011 Aug;32(7):E134-8. doi: 10.3174/ajnr.A2152. Epub 2010 Jun 10. AJNR Am J Neuroradiol. 2011. PMID: 20538824 Free PMC article.
-
Optimal duration of acquisition for dynamic perfusion CT assessment of blood-brain barrier permeability using the Patlak model.AJNR Am J Neuroradiol. 2009 Aug;30(7):1366-70. doi: 10.3174/ajnr.A1592. Epub 2009 Apr 15. AJNR Am J Neuroradiol. 2009. PMID: 19369610 Free PMC article.
-
Blood-brain barrier permeability imaging using perfusion computed tomography.Radiol Oncol. 2015 Mar 25;49(2):107-14. doi: 10.2478/raon-2014-0029. eCollection 2015 Jun. Radiol Oncol. 2015. PMID: 26029020 Free PMC article. Review.
References
-
- Fisher M. The ischemic penumbra: identification, evolution and treatment concepts. Cerebrovasc Dis. 2004;17(suppl 1):1–6. - PubMed
-
- Meuli RA. Imaging viable brain tissue with CT scan during acute stroke. Cerebrovasc Dis. 2004;17(suppl 3):28–34. - PubMed
-
- Nabavi DG, Dittrich R, Kloska SP, Nam EM, Klotz E, Heindel W, Ringelstein EB. Window narrowing: a new method for standardized assessment of the tissue at risk maximum of infarction in CT based brain perfusion maps. Neurol Res. 2007;29:296–303. - PubMed
-
- Kloska SP, Nabavi DG, Gaus C, Nam EM, Klotz E, Ringelstein EB, Heindel W. Acute stroke assessment with CT: do we need multimodal evaluation? Radiology. 2004;233:79–86. - PubMed
-
- Wintermark M, Flanders AE, Velthuis B, Meuli R, van Leeuwen M, Goldsher D, Pineda C, Serena J, van der Schaaf I, Waaijer A, Anderson J, Nesbit G, Gabriely I, Medina V, Quiles A, Pohlman S, Quist M, Schnyder P, Bogousslavsky J, Dillon WP, Pedraza S. Perfusion-CT assessment of infarct core and penumbra: receiver operating characteristic curve analysis in 130 patients suspected of acute hemispheric stroke. Stroke. 2006;37:979–985. - PubMed
Publication types
MeSH terms
Substances
Grants and funding
LinkOut - more resources
Full Text Sources
Medical
Miscellaneous
