

Early category-specific cortical activation revealed by visual stimulus inversion
- PMID: 18946504
- PMCID: PMC2566817
- DOI: 10.1371/journal.pone.0003503
Early category-specific cortical activation revealed by visual stimulus inversion
Abstract
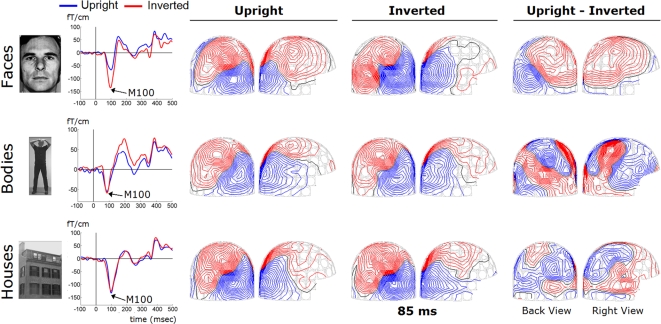
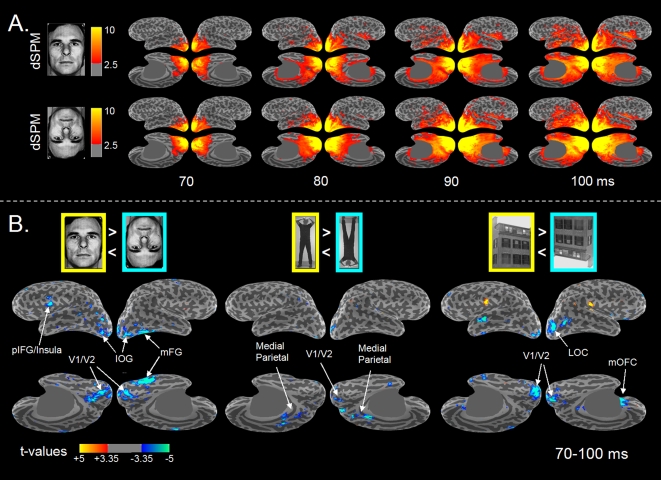
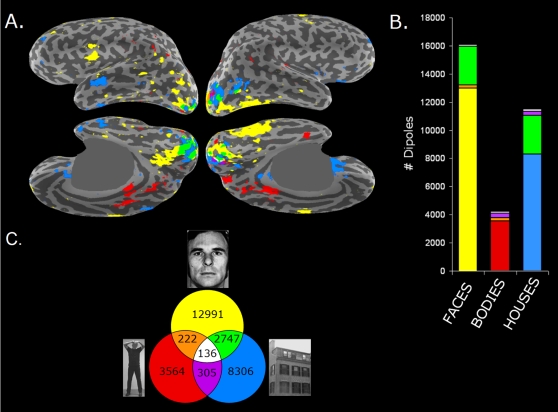
Visual categorization may already start within the first 100-ms after stimulus onset, in contrast with the long-held view that during this early stage all complex stimuli are processed equally and that category-specific cortical activation occurs only at later stages. The neural basis of this proposed early stage of high-level analysis is however poorly understood. To address this question we used magnetoencephalography and anatomically-constrained distributed source modeling to monitor brain activity with millisecond-resolution while subjects performed an orientation task on the upright and upside-down presented images of three different stimulus categories: faces, houses and bodies. Significant inversion effects were found for all three stimulus categories between 70-100-ms after picture onset with a highly category-specific cortical distribution. Differential responses between upright and inverted faces were found in well-established face-selective areas of the inferior occipital cortex and right fusiform gyrus. In addition, early category-specific inversion effects were found well beyond visual areas. Our results provide the first direct evidence that category-specific processing in high-level category-sensitive cortical areas already takes place within the first 100-ms of visual processing, significantly earlier than previously thought, and suggests the existence of fast category-specific neocortical routes in the human brain.
Conflict of interest statement
Figures


Similar articles
-
Cortical correlates of face and scene inversion: a comparison.Neuropsychologia. 2006;44(7):1145-58. doi: 10.1016/j.neuropsychologia.2005.10.009. Epub 2005 Nov 21. Neuropsychologia. 2006. PMID: 16303149
-
Face-selective processing in human extrastriate cortex around 120 ms after stimulus onset revealed by magneto- and electroencephalography.Neurosci Lett. 1998 Sep 11;253(3):147-50. doi: 10.1016/s0304-3940(98)00586-2. Neurosci Lett. 1998. PMID: 9792232
-
Inversion and contrast-reversal effects on face processing assessed by MEG.Brain Res. 2006 Oct 18;1115(1):108-20. doi: 10.1016/j.brainres.2006.07.072. Epub 2006 Aug 22. Brain Res. 2006. PMID: 16930564
-
[Neural Mechanisms Underlying the Face Inversion Effect].Brain Nerve. 2015 Oct;67(10):1231-9. doi: 10.11477/mf.1416200288. Brain Nerve. 2015. PMID: 26450075 Review. Japanese.
-
Factors Determining Where Category-Selective Areas Emerge in Visual Cortex.Trends Cogn Sci. 2019 Sep;23(9):784-797. doi: 10.1016/j.tics.2019.06.006. Epub 2019 Jul 18. Trends Cogn Sci. 2019. PMID: 31327671 Review.
Cited by
-
Men fear other men most: gender specific brain activations in perceiving threat from dynamic faces and bodies - an FMRI study.Front Psychol. 2011 Jan 26;2:3. doi: 10.3389/fpsyg.2011.00003. eCollection 2011. Front Psychol. 2011. PMID: 21713131 Free PMC article.
-
Dynamic activation of frontal, parietal, and sensory regions underlying anticipatory visual spatial attention.J Neurosci. 2011 Sep 28;31(39):13880-9. doi: 10.1523/JNEUROSCI.1519-10.2011. J Neurosci. 2011. PMID: 21957250 Free PMC article.
-
Segmentation precedes face categorization under suboptimal conditions.Front Psychol. 2015 May 26;6:667. doi: 10.3389/fpsyg.2015.00667. eCollection 2015. Front Psychol. 2015. PMID: 26074838 Free PMC article.
-
Parallel processing of face and house stimuli by V1 and specialized visual areas: a magnetoencephalographic (MEG) study.Front Hum Neurosci. 2014 Nov 7;8:901. doi: 10.3389/fnhum.2014.00901. eCollection 2014. Front Hum Neurosci. 2014. PMID: 25426050 Free PMC article.
-
The Extrastriate Body Area and identity processing: An fMRI guided TMS study.Physiol Rep. 2021 Apr;9(8):e14711. doi: 10.14814/phy2.14711. Physiol Rep. 2021. PMID: 33938163 Free PMC article.
References
-
- Mishkin M, Ungerleider LG, Macko KA. Object vision and spatial vision: two cortical pathways. Trends Neurosci. 1983;6:414–417.
-
- Goodale MA, Milner AD. Separate visual pathways for perception and action. Trends Neurosci. 1992;15:20–25. - PubMed
-
- Pasupathy A, Connor CE. Responses to contour features in macaque area V4. J Neurophysiol. 1999;82:2490–2502. - PubMed
Publication types
MeSH terms
Grants and funding
LinkOut - more resources
Full Text Sources
