. 2008;3(10):e3513.
doi: 10.1371/journal.pone.0003513. Epub 2008 Oct 23.

Olfactory interference during inhibitory backward pairing in honey bees

Affiliations

Olfactory interference during inhibitory backward pairing in honey bees

Matthieu Dacher et al. PLoS One. 2008.

Abstract

Background: Restrained worker honey bees are a valuable model for studying the behavioral and neural bases of olfactory plasticity. The proboscis extension response (PER; the proboscis is the mouthpart of honey bees) is released in response to sucrose stimulation. If sucrose stimulation is preceded one or a few times by an odor (forward pairing), the bee will form a memory for this association, and subsequent presentations of the odor alone are sufficient to elicit the PER. However, backward pairing between the two stimuli (sucrose, then odor) has not been studied to any great extent in bees, although the vertebrate literature indicates that it elicits a form of inhibitory plasticity.

Methodology/principal findings: If hungry bees are fed with sucrose, they will release a long lasting PER; however, this PER can be interrupted if an odor is presented 15 seconds (but not 7 or 30 seconds) after the sucrose (backward pairing). We refer to this previously unreported process as olfactory interference. Bees receiving this 15 second backward pairing show reduced performance after a subsequent single forward pairing (excitatory conditioning) trial. Analysis of the results supported a relationship between olfactory interference and a form of backward pairing-induced inhibitory learning/memory. Injecting the drug cimetidine into the deutocerebrum impaired olfactory interference.

Conclusions/significance: Olfactory interference depends on the associative link between odor and PER, rather than between odor and sucrose. Furthermore, pairing an odor with sucrose can lead either to association of this odor to PER or to the inhibition of PER by this odor. Olfactory interference may provide insight into processes that gate how excitatory and inhibitory memories for odor-PER associations are formed.


Conflict of interest statement

Competing Interests: The authors have declared that no competing interests exist.

Figures

Figure 1
Figure 1. Olfactory interference: time course of the PER (A) and fitted ratio of survival rate (B).
(A) Proportion of bees which are still displaying the initial PER as a function of the time after the onset of sucrose feeding (which started at 0 s). There is one curve for each of the four experimental groups: animals presented with an air puff, with no treatment (control group), with 1-nonanol or with octanal. The air puff or the odors were delivered 15 s after the onset of the sucrose feeding and lasted 4 s; this is indicated by the green area on the plot. Values in parenthesis are the number of animals used in each group. In subsequent figures, the odors are presented pooled because they never differed significantly. (B) Same data as in A, displayed in three sections: before odor onset (0–14 s), during odor presentation to one second after (15–19 s) and after the odor (20–34 s). For each of these time periods, Cox regression provided three ratios of the PER survival rates. Within each group, the PER survival rate is the proportion of bees that did not stop displaying a PER during a given time period. The Cox regression estimates fitted ratios of these PER survival rates. The ratios that are represented are (survival in the air-treated group)/(survival in the control group), (survival in the odor-treated groups)/(survival in the control group), and (survival in the odor-treated groups)/(survival in the air-treated group). A 95% confidence interval is determined for each ratio, illustrated by the error bars. The ratios odor/air and odor/control are significantly lower than 1 during the 15–19 s time period (the odor presentation period), which means that the odor-treated groups have a significantly lower “survival” rate than the air-treated or the control group during the odor presentation; in other words, they retract their proboscis more often. Note that the scale is logarithmic. This is because Cox regression uses an exponential equation that produces very large (and asymmetric) error bars. Furthermore, the error bars increase in size when the number of animals still displaying a PER decreases at later time points, because the sample size is decreasing and the estimation of the ratio loses precision. Hence, the error bars are larger during the last time period (19–34 s) because few bees are still displaying a PER.
Figure 2
Figure 2. Olfactory interference tested at 7, 15 and 30 s: time course of the PER (A) and fitted ratio of survival rate (B).
This figure is similar to Figure 1, except that the four different experimental groups were: odor presented at 7 s, odor presented at 15 s, odor presented at 30 s, and no treatment. Therefore, each group was stimulated once with the odor (at 7 s, 15 s or 30 s), or not at all (control group). The odor was either 1-nonanol or octanal, and the results for both odors are presented pooled because they were not significantly different. In part B, the time-periods correspond to before any treatment (0–6 s), during to one second after the odor presentation in the 7 s group (7–11 s), the between period (12–14 s), during to one second after the odor presentation in the 15 s group (15–19 s), the between period (20–29 s) and during to one second after the odor presentation in the 30 s group (30–34 s). All other details are as in Figure 1.
Figure 3
Figure 3. Olfactory interference with nectar and pollen foragers (A, B).
This experiment is similar to the one shown in Figure 2, except that both pollen and nectar foragers were used, and that the odor was presented at 15 s, 30 s, or not at all (control group). A, B: details are as in previous figures. In part B, some points are missing because the Cox regression did not converge to a solution for them due to the very low number of bees still displaying a PER after 30 s in the 15 s groups.
Figure 4
Figure 4. Effect of olfactory interference on a subsequent learning.
(A) Details of the protocol used. One hour after the backward pairing, the bees were trained with a single forward pairing, followed by a retrieval test 3 hours after the training. The odor used was either 1-nonanol or octanal. For the 15 s and the 30 s groups, the same odor was used for backward and forward pairing. The animals that were trained in this forward pairing are those of Figure 3 (see this figure to their performance during olfactory interference). Although the same animals were used as in A, the sample size is lower because some bees died or did not respond to the sucrose after backward pairing (the proportion of bees discarded for these reasons was the same across the six groups: 5 degrees of freedom χ2 = 1.8624, p = 0.868, and the olfactory interference effect was also significant for the remaining bees). After conducting the whole experiment, animals were assigned to one of five behavioral groups according to the time at which they retracted their proboscis during the backward pairing (see details in figure). These five groups are used for the analysis in part B. B: Performance of the bees during the retrieval test, as a function of their behavioral group. The boxes at the base of each bar indicate the sample size. An alternative representation is provided in supplementary Figure S4; this figure also provides a justification for the attribution of the groups in part A.
Figure 5
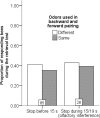
Figure 5. Effect of a backward pairing with one odor on the response to this odor and another odor.
Performance of the bees during a retrieval test. This test was performed 3 hours after a single trial with each of two odors, one having been used in a previous backward pairing for olfactory interference (“same”) and the other being a novel odor (“different”). The bars are presented as a function of the behavior of the bees during the backward pairing. The boxes at the base of each bar indicate the sample size. Three bees only extended their proboscis beyond 19 seconds, so they are not represented here.
Figure 6
Figure 6. Effect of histaminergic drugs on sucrose sensitivity modulation index.
(A) The median (50th quantile) sucrose sensitivity modulation index (MI) for a range of concentrations of cimetidine. The modulation index corresponds to the variation that occurs in sucrose sensitivity before and after treatment (see methods). Error bars are the interquartile interval, i.e. interval between 25th and 75th quantiles. Note that when the 25th and/or the 75th quantile have the same value than the median there is no error bar to display (e.g. group cimetidine 10 mM). Numbers in parenthesis are the sample size. (B) The sucrose sensitivity modulation index for bees treated with histamine. Data are shown in the same manner as in A.
Figure 7
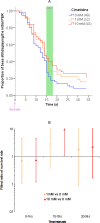
Figure 7. Effect of cimetidine on olfactory interference.
(A) Proportion of bees that are still releasing the initial PER as a function of the time after the onset of the sucrose feeding. There were three groups of bees: animals injected into the deutocerebrum with 0 mM (control), with 1 mM or with 10 mM of cimetidine 15 minutes before starting the experiment. Other details are as in Figure 1A. (B) Ratio of the “survival rate” of the PER in the Cox regression for bees treated with 0 mM, 1 mM or 10 mM of cimetidine. The data are presented as in figure 1B.
Figure 8
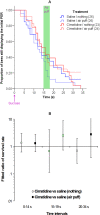
Figure 8. Control for the specificity of cimetidine effect.
(A) Proportion of bees treated with 0 or 10 mM cimetidine that continue to release the initial PER as a function of time when presented with nothing or an air puff 15 s after sucrose presentation. Other details are as in Figure 1A. (B) Ratio of the “survival rate” of the PER in the Cox regression for bees treated with 0 mM or 10 mM of cimetidine. The data are presented as in figure 1B.
Figure 9
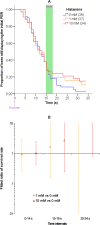
Figure 9. Effect of histamine on olfactory interference.
(A) Proportion of bees that are still releasing the initial PER as a function of the time after the onset of the sucrose feeding. There were three groups of bees: animals injected into the deutocerebrum with 0 mM (control), with 1 mM or with 10 mM of histamine 15 minutes before starting the experiment. The odor (either 1-nonanol or octanal) were presented 15 s after the onset of the sucrose feeding, during 4 s. Other details are as in Figure 1A. (B) Ratio of the “survival rate” of the PER in the Cox regression for bees treated with 0 mM, 1 mM or 10 mM of cimetidine. The data are presented as in figure 1B.

Similar articles

Cited by

References

    1. Menzel R, Giurfa M. Dimensions of cognition in an insect, the honeybee. Behav Cogn Neurosci Rev. 2006;5:24–40. - PubMed
    1. Menzel R, Leboulle G, Eisenhardt D. Small Brains, Bright Minds. Cell. 2006;124:237–239. - PubMed
    1. Menzel R, Giurfa M. Cognitive architecture of a mini-brain: the honeybee. Trends Cogn Sci. 2001;5:62–71. - PubMed
    1. Milner B, Squire LR, Kandel ER. Cognitive neuroscience and the study of memory. Neuron. 1998;20:445–468. - PubMed
    1. Krasne FB, Glanzman DL. What We can Learn from Invertebrate Learning. Annual Review of Psychology. 1995;46:585–624.

Publication types