. 2008 Apr 8:2:1.
doi: 10.3389/neuro.03.001.2008. eCollection 2008.

Period concatenation underlies interactions between gamma and beta rhythms in neocortex

Affiliations

Period concatenation underlies interactions between gamma and beta rhythms in neocortex

Anita K Roopun et al. Front Cell Neurosci. .

Abstract

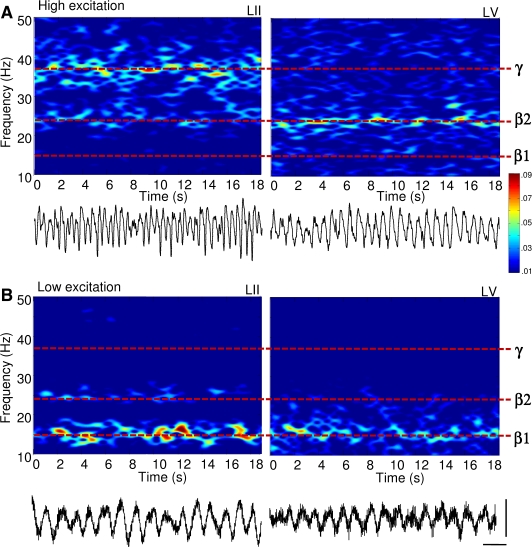
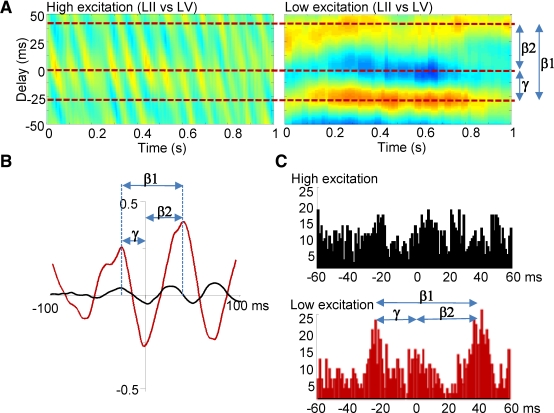
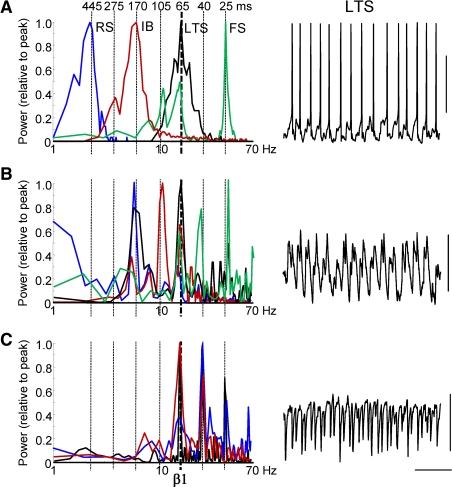
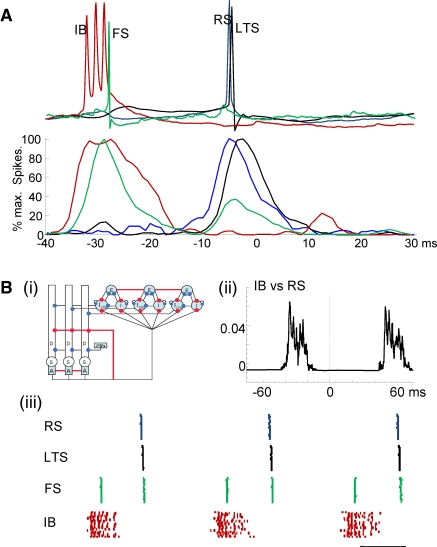
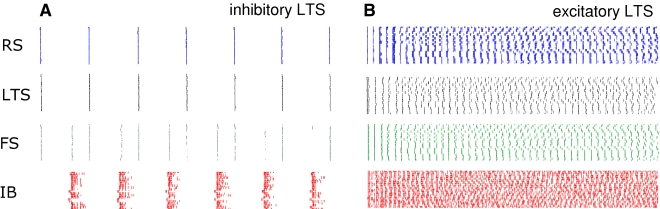
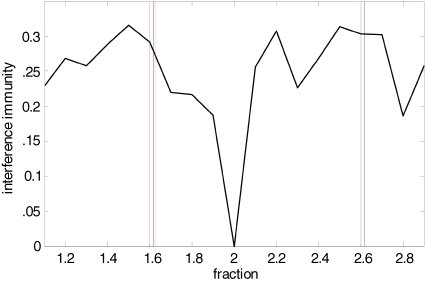
The neocortex generates rhythmic electrical activity over a frequency range covering many decades. Specific cognitive and motor states are associated with oscillations in discrete frequency bands within this range, but it is not known whether interactions and transitions between distinct frequencies are of functional importance. When coexpressed rhythms have frequencies that differ by a factor of two or more interactions can be seen in terms of phase synchronization. Larger frequency differences can result in interactions in the form of nesting of faster frequencies within slower ones by a process of amplitude modulation. It is not known how coexpressed rhythms, whose frequencies differ by less than a factor of two may interact. Here we show that two frequencies (gamma - 40 Hz and beta2 - 25 Hz), coexpressed in superficial and deep cortical laminae with low temporal interaction, can combine to generate a third frequency (beta1 - 15 Hz) showing strong temporal interaction. The process occurs via period concatenation, with basic rhythm-generating microcircuits underlying gamma and beta2 rhythms forming the building blocks of the beta1 rhythm by a process of addition. The mean ratio of adjacent frequency components was a constant - approximately the golden mean - which served to both minimize temporal interactions, and permit multiple transitions, between frequencies. The resulting temporal landscape may provide a framework for multiplexing - parallel information processing on multiple temporal scales.

Keywords: EEG; beta rhythm; gamma rhythm; inhibition; neocortex.


Figures

Figure 1
Figure 1
Reduction in excitatory drive to neocortex transforms concurrent gamma (35–45 Hz) and beta2 (22–28 Hz) oscillations into a beta1 (13–18 Hz) rhythm. Spectrograms of local field potential data from LII and LV in rat cortex in vitro. (A) Laminar separation of gamma (LII) and beta2 (LV) frequency population rhythms in the presence of 400 nM kainate. Example traces (1 s epoch) of superficial (layer II), and deep (layer V) recordings showing the nature of the two rhythms are shown below. (B) Acute reduction in glutamatergic excitation in neocortex with 2.5 μM NBQX, following 2 h of stable gamma/beta2 oscillations abolished both field potential rhythms, generating persistent beta1 frequency rhythms in both laminae. Example traces (1 s epochs) of field potential beta1 frequency rhythms in layer II and layer V are shown below. Scale bars 100 ms, 50 μV.
Figure 2
Figure 2
Asymmetric local field potential and spike cross correlations suggest period concatenation across laminae. (A) Cross correlograms from LFP data. During coexpressed gamma and beta2 rhythms (high excitation condition) the phase relationship between LII and LV varied rhythmically at beta1 frequency. When beta1 rhythms were expressed in the local field potential from LII and LV, a phase relationship was seen with LV leading and lagging LII by one gamma and one beta2 period, respectively. (B) Mean cross correlation function between LII and LV (60 epochs of data, n = 5 slices) for coexpressed gamma and beta2 field potentials (black) and beta1 rhythms (red) illustrating the generation of a stable, asymmetric temporal relationship between laminae on reduction in glutamatergic drive. (C)Graphs show distribution of LV units with respect to adjacent LII units during coexpressed gamma/beta2 (black) and beta1 (red) field potential rhythms.
Figure 3
Figure 3
Multiple concatenation sums are evident in spike outputs and synaptic inputs in single neurons. (A) Frequency distribution of intracellularly recorded action potential generation from resting membrane potential (1/interspike interval, n = 500 spikes) during population beta1 rhythm for LII regular spiking cells (RS, blue), LII fast spiking cells (FS, green), LIII low threshold spiking cells (LTS, black) and LV intrinsic bursting cells (IB, red). Vertical dashed lines show successive concatenation sums from the original observed frequencies: gamma (25 ms) and beta2 (40 ms). Example trace shows 1 s epoch of activity from a LIII LTS cell illustrating action potential generation (truncated at −20 mV) at beta1 frequencies. (B) Frequency distribution of excitatory postsynaptic potential (EPSP) inputs to each of the 4 cell types, taken from power spectra (n = 5, 10 s epochs for each cell type) with mean membrane potential held at −70 mV. Example trace is 1 s epoch of EPSP data from an LTS cell. Note the beta1 frequency compound EPSP trains consisting of doublets. (C) Frequency distribution of inhibitory postsynaptic potential (IPSP) inputs to each of the 4 cell types, taken from power spectra (n = 5, 2 s epochs for each cell type) with mean membrane potential held at −30 mV. Example trace is 1 s epoch of IPSP data from an LTS cell. Scale bars 20 mV (A), 2 mV (B), 10 mV (C) and 200 ms.
Figure 4
Figure 4
Experimental and computational modeling evidence for recurrent, sequential activation of deep and superficial laminae during the beta1 population rhythm. (A) Example membrane potential changes in each neuron type temporally aligned to peak positivity in concurrently recorded field potentials. Lower graph shows pooled action potential distributions for IB (red), FS (green), RS (blue) and LTS (black) cells. Note IB and superficial layer FS neurons fire approximately one gamma period before RS and LTS cells in superficial layers. (B) (i) Cartoon representation of the computational model. The populations in both layers consist of twenty cells, although we only draw three of each cell type in the figure. The deep layer consists of IB cells of three compartments: D, the dendrite; S, the soma; and A, the axon. The superficial layer contains three cell types: RS cells (E), basket cells (I), LTS cells (LTS). Termination points of excitatory and inhibitory synapses are illustrated by red and blue circles, respectively. We connect all of the IB cell axons and RS cells with gap junctions (indicated by the red lines). (ii) The average cross-correlation between the spiking activity of the RS cell population and IB cell population. (iii) The spiking activity of the superficial layer cells (FS, RS and LTS cells) and layer V (IB cells). Each colored dot represents a spike in a single compartment. The horizontal line indicates 20 ms.
Figure 5
Figure 5
Excitatory LTS neurons do not foster period concatenation in simulations. Simulation results comparing 0.5 s epochs of spike activity (shown as rasters) in each of the 4 cell types, using inhibitory LTS cell output (A) and excitatory LTS cell output (B). All other model parameters were kept the same. With excitatory LTS cells note the absence of pauses in the high frequency firing rates in all cells. RS = regular spiking, superficial layer neuron, LTS = low threshold spiking superficial layer neuron, FS = fast spiking superficial layer interneuron, IB = layer V intrinsic bursting neuron.
Figure 6
Figure 6
Interference predictions for ratios of frequency pairs. Interference immunity is a simple numerical model used to estimate the degree of interference between peak frequencies occurring at different ratios. It is calculated as follows: First, the starting peak frequency is set to 2 Hz and subsequent peak frequencies up to a limit of 2 kHz are generated by multiplying with a fraction value ranging from 1.1 to 2.9. Second, the interferences between all pairs of peak frequencies are calculated as I(f1, f2) = max [modulo (f1, f2), 1 − modulo (f1, f2)]/f2 where f1 > f2. The potential minimum is 0 which means that an integer multiple of a lower peak frequency f1 equals the higher peak frequency f2. The potential maximum is 0.5 which means that the multiplied frequency of the lower frequency f1 is f1/2 Hz away from f2. The interference immunity represents the average value over all pairs. The graph demonstrates that immunity from interference is maximal around c.1.6 and 2.6 – the former corresponding to the ratios of field potential, EPSP and IPSP frequencies observed, the latter corresponding to ratios for action potential generation, with 2.6 approximately equal to 1.62 (see Figure 3).

Similar articles

Cited by

References

    1. Ahissar E., Haidarliu S., Zacksenhouse M. (1997). Decoding temporally encoded sensory input by cortical oscillations and thalamic phase comparators. Proc. Natl. Acad. Sci. U.S.A. 94, 11633–1163810.1073/pnas.94.21.11633 - DOI - PMC - PubMed
    1. Atela O., Gole C., Hotten S. (2002). A dynamical system for plant pattern formation: a rigorous analysis. J. Nonlinear Sci. 12, 641–67610.1007/s00332-002-0513-1 - DOI
    1. Baker S. N., Chiu M., Fetz E. E. (2006). Afferent encoding of central oscillations in the monkey arm. J. Neurophysiol. 95, 3904–391010.1152/jn.01106.2005 - DOI - PubMed
    1. Borgers C., Epstein S., Kopell N. J. (2005). Background gamma rhythmicity and attention in cortical circuits: a computational study. Proc. Natl. Acad. Sci. U.S.A. 102, 7002–700710.1073/pnas.0502366102 - DOI - PMC - PubMed
    1. Bragin A., Jando G., Nadasdy Z., Hetke J., Wise K., Buzsaki G. (1995). Gamma (40–100 Hz) oscillations in the hippocampus of the behaving rat. J. Neurosci. 15, 47–60 - PMC - PubMed

LinkOut - more resources