. 2007 Dec 31:1:1.
doi: 10.3389/neuro.03.001.2007. eCollection 2007.

Effects of N-cadherin disruption on spine morphological dynamics

Affiliations

Effects of N-cadherin disruption on spine morphological dynamics

Shreesh P Mysore et al. Front Cell Neurosci. .

Abstract

Structural changes at synapses are thought to be a key mechanism for the encoding of memories in the brain. Recent studies have shown that changes in the dynamic behavior of dendritic spines accompany bidirectional changes in synaptic plasticity, and that the disruption of structural constraints at synapses may play a mechanistic role in spine plasticity. While the prolonged disruption of N-cadherin, a key synaptic adhesion molecule, has been shown to alter spine morphology, little is known about the short-term regulation of spine morphological dynamics by N-cadherin. With time-lapse, confocal imaging in cultured hippocampal neurons, we examined the progression of structural changes in spines following an acute treatment with AHAVD, a peptide known to interfere with the function of N-cadherin. We characterized fast and slow timescale spine dynamics (minutes and hours, respectively) in the same population of spines. We show that N-cadherin disruption leads to enhanced spine motility and reduced length, followed by spine loss. The structural effects are accompanied by a loss of functional connectivity. Further, we demonstrate that early structural changes induced by AHAVD treatment, namely enhanced motility and reduced length, are indicators for later spine fate, i.e., spines with the former changes are more likely to be subsequently lost. Our results thus reveal the short-term regulation of synaptic structure by N-cadherin and suggest that some forms of morphological dynamics may be potential readouts for subsequent, stimulus-induced rewiring in neuronal networks.

Keywords: N-cadherin; cell adhesion; hippocampus; motility; spine dynamics; structural constraints.


Figures

Figure 1
Figure 1
Ten-minute AHAVD (but not AADHV) peptide treatment disrupts N-cadherin mediated adhesion. (A) Differential interference contrast images of L cells plated onto slides at different time-points, after being treated with HAV, SCR, or HBS for 10 minutes (see Materials and methods section). Scalebar = 650 μm. (B) Plot of the aggregation efficiency of L cells as a function of time, measured as N0/Nt (see Materials and methods section). A higher N0/Nt value indicates greater adhesion. HAV – red, SCR – blue, HBS – green.
Figure 2
Figure 2
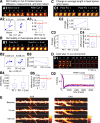
Spine dynamics at two timescales. All spines in this figure are from control neurons (SCR-treated); T1 was the baseline time-point taken before control treatment, and T2 was the time-point 75 minutes after it. (A) Image acquisition protocol. Each time-point (e.g., T1 or T2) consists of five image stacks taken once every minute (fast timescale). Different time-points (T1 or T2) are more than an hour apart (slow timescale). (B) Time-lapse images of two example spines from a control neuron that show spine loss (top image) and gain (bottom image), i.e., spine turnover – the most extreme form of spine morphological change. (C) Characterizing morphological dynamics in a single spine at the two timescales, with spine length as the example quantifier. (C1) Time-lapse images of an example spine from a control neuron acquired at the two time-points. The automated centerline generated to compute spine length at each instant is indicated as a one pixel-wide black curve (see Materials and methods section). (C2) Instantaneous length (Lt, blue circles); slow length dynamics, or average length [average (Lt) within each time-point, black cross]; and fast length dynamics, or length motility (Σ|ΔLt| within each time-point, red asterisk). The spine in (C1) shows a decrease in average length (slow timescale), but an increase in length motility (fast timescale). (D) Characterizing dynamics in a group of spines, with average length (slow length dynamics) as the example quantifier. (D1) Time-lapse images of 10 representative spines A–J from a control neuron, in which 4 spines A–D show an increase in average length, 2 spines E–F show no significant change, and 4 spines G–J show a decrease, with respect to T1. To determine the magnitude of change in the value of a quantifier that can be considered significant, we have experimentally measured noise thresholds that estimate the extent of change that can occur due to various sources of noise (Figure 3). (D2) (Left panel) Average length of spines A–J at the two time-points T1 and T2. (Right panel) Probabilities of change (increase – Incr, decrease – Decr, no change – No Δ) in the average length of spines A–J at time-point T2 with respect to time-point T1, calculated as fractions of spines. In the rest of the paper, dynamics in spine groups are characterized with probabilities, and comparisons between treatment and control are made with respect to these probabilities. Scale bars in yellow = 1 μm.
Figure 3
Figure 3
Estimation of noise-floors. (A) Estimate of noise in the measurement of center-of-mass motility of spines. (A1) Time-lapse images of a representative spine from an EGFP-expressing neuron before and 20 minutes after treatment with cyt-D (2 μM). (A2) Each panel shows the locus of successive instantaneous center-of-mass positions over the 5 minutes within a time-point (after translational normalization to center the locus at the origin). The large dot represents the position of the spine at the first minute within that time-point. The locus in each panel gives a visual indication of the extent to which the spine is motile. The center-of-mass motility value (net movement) of the spine within a time-point is indicated in microns. Cyt-D application causes a reduction in center-of-mass motility, as expected. (A3) Box plot showing the distribution of center-of-mass motility after cyt-D treatment (n = 229 spines). The 95-percentile value in this distribution (0.12 μm) was chosen as the noise threshold. (B) Estimate of noise in the change in center-of-mass motility. (B1) Time-lapse images of a representative spine at two time-points after fixing neurons and immunostaining EGFP-expressing neurons. (B2) Loci of the instantaneous center-of-mass positions of the example spine in (B1) within each of the two time-points (left and right panels respectively). The numbers in microns indicate total movement at that time-point. The difference between these two values is small, as expected. (B3) Center-of-mass motility of the example spine in (B1) at two time-points. (B4) Box plots showing the distributions of center-of-mass motility values at the two time-points after fixation (n = 128 spines). (B5) Box plot of the distribution of the absolute difference between the center-of-mass motility values measured at the two time-points. The 95-percentile value of this distribution (0.039 μm) noise was chosen as the noise threshold for change in center-of-mass motility. (C) Estimate of noise in the change in average length of spines. (C1) Time-lapse images of the example spine shown in (B1) with the instantaneous centerlines. (C2) Average length of the spine at two time-points. (C3) Box plots showing the distributions of spine average length values at the two time-points after fixation (n = 128 spines). (C4) Box plot of the distribution of the absolute difference between average length values measured at the two time-points. The 95-percentile value of this distribution (0.14 μm) noise was chosen as the noise threshold for change in average length. (D) Fluorescence recovery after photobleaching (FRAP) of EGFP. (D1) Time-lapse images of representative spines from HAV- and SCR-treated cells showing FRAP. (D2) Individual FRAP curves from four spines for each of the two treatments (red dots – HAV, blue dots – SCR) along with the average FRAP curves for each treatment (thick solid lines). Scale bar = 1 μm. (E) Time-lapse images of dendritic segments from neurons treated with SCR and HAV respectively. Scale bar = 5 μm.
Figure 4
Figure 4
Spines show an increase in center-of-mass motility (fast timescale dynamics) after surface N-cadherin disruption. (A) Time-lapse images of representative persistent spines from AHAVD (HAV) and AADHV (SCR) treated neurons acquired at baseline, 75 minutes after treatment, and 180 minutes after treatment. The black dot superposed on each image represents the center-of-mass of the spine at that instant as computed from the thresholded image (see Materials and methods section). Scale bar = 1 μm. (B) Center-of-mass calculations for the example spines shown in A. (B1) Each panel shows the locus of successive instantaneous center-of-mass positions over the 5 minutes within a time-point (after translational normalization to center the locus at the origin). The large filled circle represents the position of the spine at the first minute within that time-point. The locus in each panel gives a visual indication of the extent to which the spine is motile. The center-of-mass motility value (net movement) of the spine within a time-point is indicated above the panel. Scale bar = 0.1 μm and applies to all panels. (B2) Center-of-mass motility of the example spines is plotted normalized to baseline. There was no significant difference at the baseline time-point in the center-of-mass motility values between the HAV- and SCR-treated spine populations. (C) Summary data (mean ± s.e.m) showing the probabilities of increase (pIncrease), no change (pNochange), and decrease (pDecrease) in the center-of-mass motility of all persistent spines. The motility value of a spine at each time-point was compared to that at baseline to determine the nature of change. Spine data in this and subsequent figures are based on 690 spines from HAV-treated cells, and 803 spines from SCR-treated cells (see Materials and methods section for details).
Figure 5
Figure 5
Spines shrink in length (slow timescale dynamics) after surface N-cadherin disruption. (A) Time-lapse images of representative persistent spines from HAV- and SCR-treated neurons. The single pixel curve superposed on each image represents the instantaneous centerline of the spine generated using a thresholded version of the raw image (see Materials and methods section). Scale bar = 1 μm. (B) Instantaneous and average lengths of example spines shown in A. Instantaneous lengths are denoted by filled circles, and average lengths at the three time-points by ‘X’. (C) Summary data (mean ± s.e.m) from all the spines showing the probabilities of increase (pIncrease), no change (pNochange), and decrease (pDecrease) in the average length. These are calculated by comparing the average length of a spine at each time point to that at baseline (see Materials and methods section).
Figure 6
Figure 6
Acute disruption of surface N-cadherin induces spine loss. (A) Time lapse images of representative, 3-D reconstructed dendrites from neurons expressing soluble EGFP, obtained before (baseline) and 180 minutes after treatment. Left and right panels show SCR- and HAV-treated dendrites respectively. Scale bar = 5 μm. (B) Summary data (mean ± s.e.m) showing from left to right, spine turnover index [(loss + gain)/total], spine gain fraction, and spine loss fraction. (C) Examining miniature synaptic events (mEPSCs) with voltage-clamp recordings to determine functional effects. (C1) Sample mEPSCs from HAV- and SCR-treated cells recorded at 30 minutes after treatment. (C2) mEPSC frequency and amplitude plots. Data represent mean ± s.e.m, n = 9 and 8 neurons for HAV and SCR respectively.
Figure 7
Figure 7
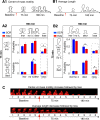
N-cadherin disruption results in increased correlation between early changes in spine dynamics and later spine loss. (A1) Schematic showing a spine with an increase in center-of-mass motility at 75 minutes and its possible states (with respect to center-of-mass motility) at 180 minutes. (A2) Joint probability distribution between center-of-mass motility at 75 minutes and spine fate (with respect to center-of-mass motility) at 180 minutes (incr – probability of increase, no Δ – no change, decr – decrease. The possible states of a spine at 75 and 180 minutes yield a joint distribution with 2 × 3 states in total. This distribution for HAV-treated spines is significantly different from that of SCR-treated spines (control) as indicated by ‘*’ (see Materials and methods section). The dashed box highlights the comparisons of interest and points to the increase with respect to control in the fraction of spines that first show an increase in center-of-mass motility and are then lost. Note that the fraction of spines that show other center-of-mass motility (no change or decrease) at 75 minutes and are then lost is not different between treatment and control. At 75 minutes, the no change and decrease in motility states have been merged to improve visualization while highlighting the significant effect in increase in motility. (B1) Schematic showing a spine with decrease in average length at 75 minutes and its possible states (with respect to average length) at 180 minutes. (B2) Joint probability distribution between average spine length behavior at 75 minutes and spine fate 180 minutes; 2 × 3 states in total. The joint distributions of HAV- and SCR-treated spines are significantly different. Further, spines that show a decrease in length at 75 minutes are preferentially lost at 180 minutes after HAV treatment - dashed box. We tested for correlations between average length and center-of-mass motility at 75 minutes and found no significant difference between HAV and control spines (data not shown). At 75 minutes, the no change and increase in length states have been merged to improve visualization while highlighting the significant effect in decrease in length. (C) (Top panel) Time-lapse, volume rendered images of an HAV-treated spine that showed an increase in motility at 75 minutes and was subsequently lost at 180 minutes. (Bottom panel) Volume rendered images of an HAV treated spine that first decreased in length and was then lost. Red arrows indicate the 10-minute application of treatment at time t = 0 minute.

References

    1. Aakalu G., Smith W. B., Jiang C., Nguyen N., Schuman E. M. (2001). Dynamic visualization of dendritic protein synthesis in hippocampal neurons. Neuron 30, 489–50210.1016/S0896-6273(01)00295-1 - DOI - PubMed
    1. Abe K., Chisaka O., Van Roy F., Takeichi M. (2004). Stability of dendritic spines and synaptic contacts is controlled by alpha N-catenin. Nat. Neurosci. 7, 357–36310.1038/nn1212 - DOI - PubMed
    1. Anastasiadis P. Z., Reynolds A. B. (2001). Regulation of Rho GTPases by p120-catenin. Curr. Opin. Cell Biol. 13, 604–61010.1016/S0955-0674(00)00258-1 - DOI - PubMed
    1. Bailey C. H., Chen M., Keller F., Kandel E. R. (1992). Serotonin-mediated endocytosis of apCAM: an early step of learning-related synaptic growth in Aplysia. Science 256, 645–64910.1126/science.1585177 - DOI - PubMed
    1. Benson D. L., Tanaka H. (1998). N-cadherin redistribution during synaptogenesis in hippocampal neurons. J. Neurosci. 18, 6892–6904 - PMC - PubMed