. 2007 Nov 2:1:3.
doi: 10.3389/neuro.10.003.2007. eCollection 2007.

The effects of background noise on the neural responses to natural sounds in cat primary auditory cortex

Affiliations

The effects of background noise on the neural responses to natural sounds in cat primary auditory cortex

Omer Bar-Yosef et al. Front Comput Neurosci. .

Abstract

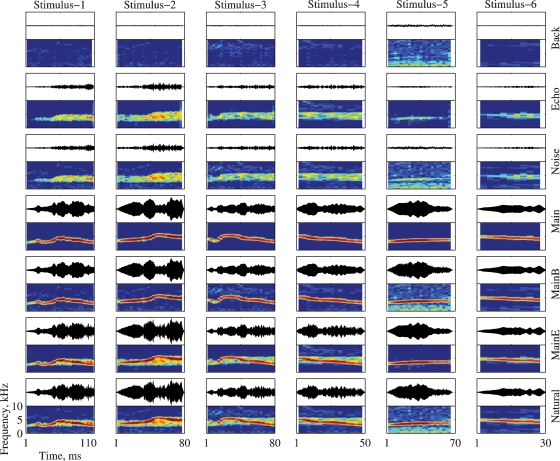
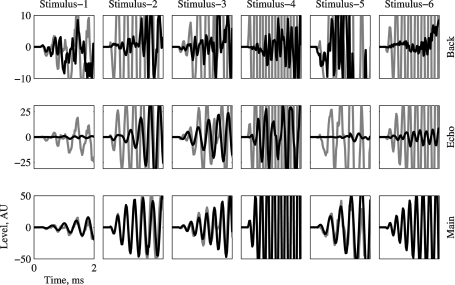
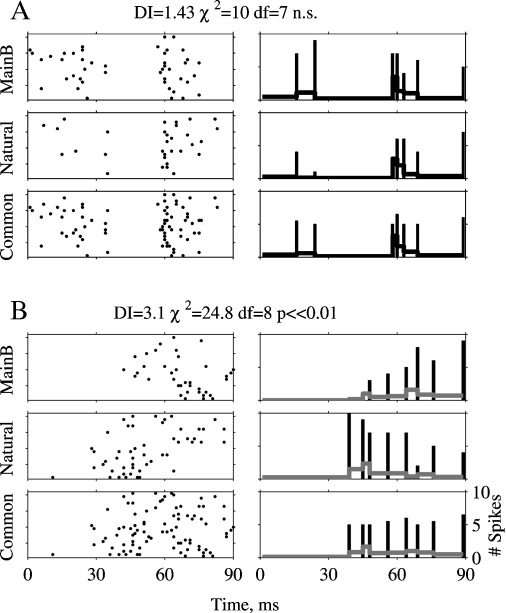
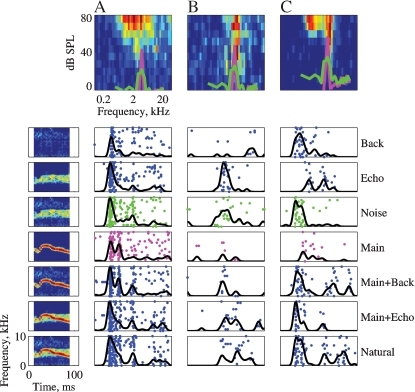
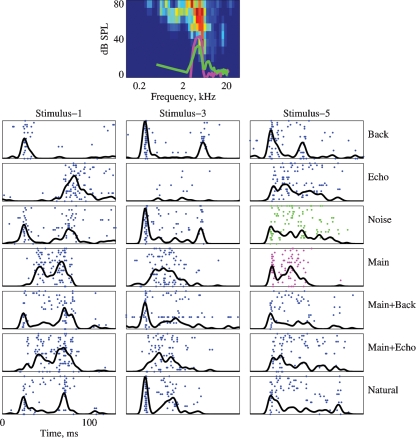
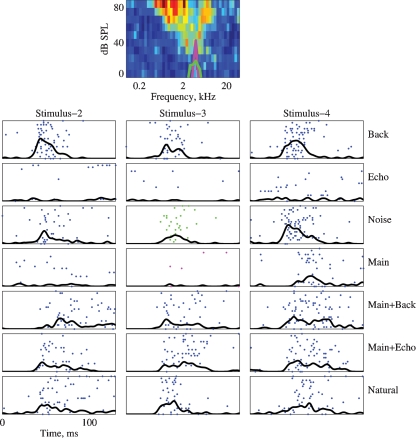
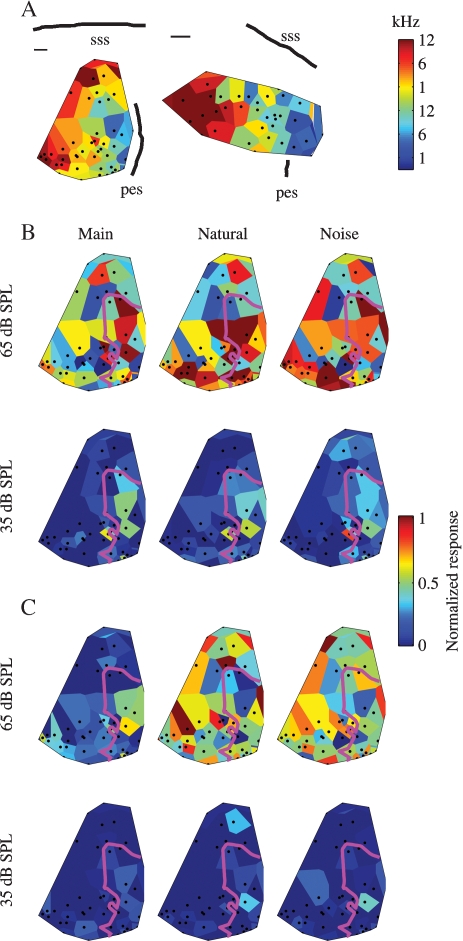
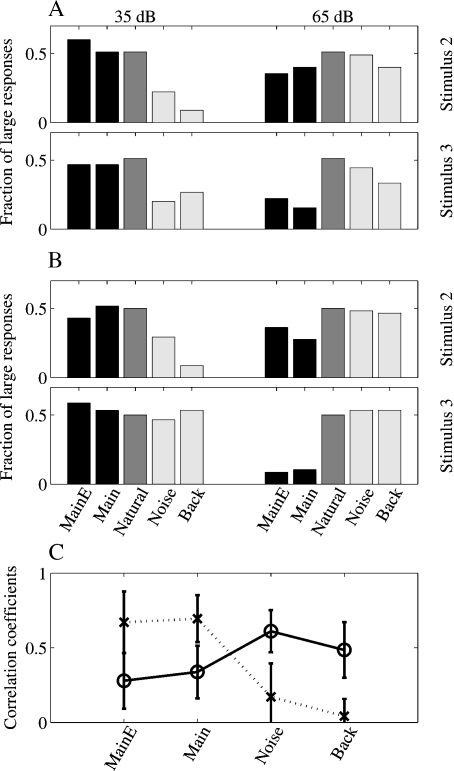
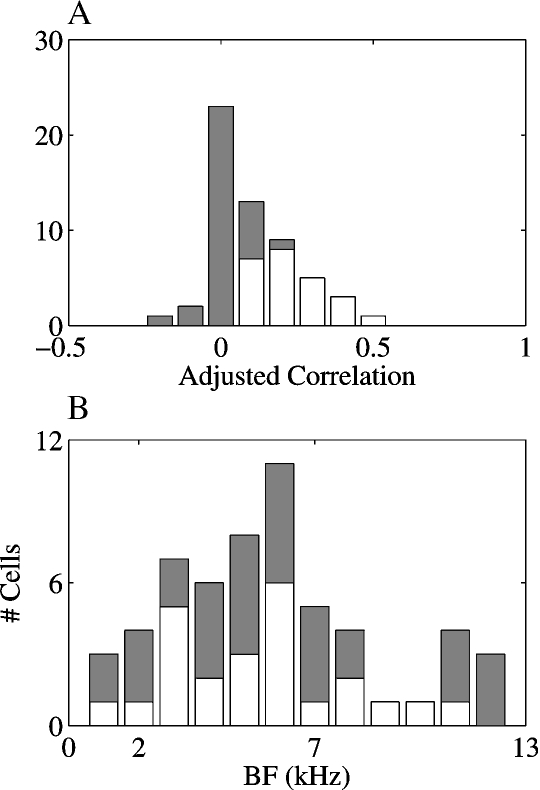
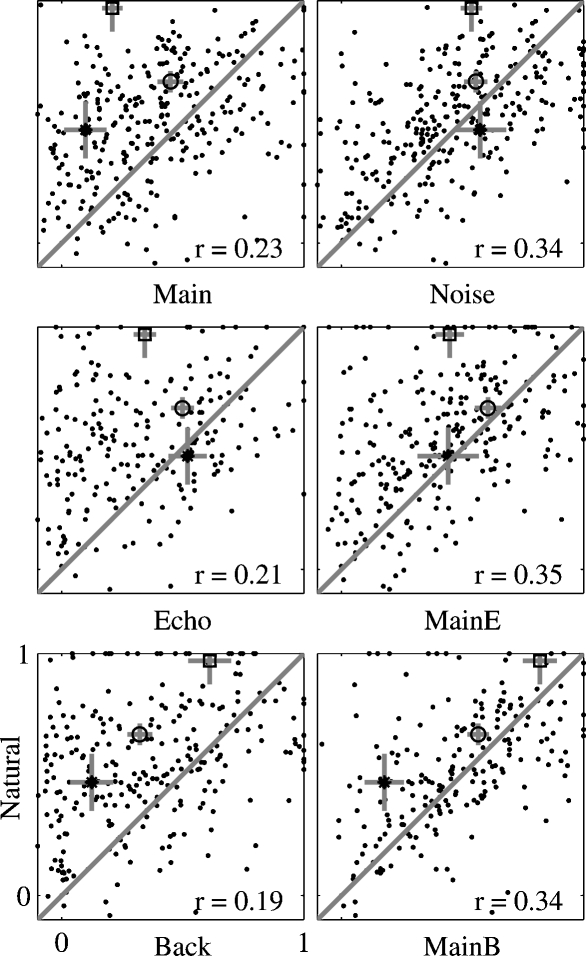
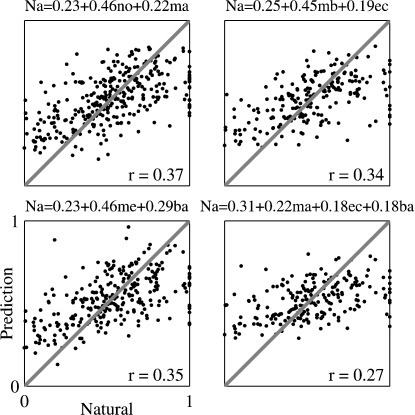
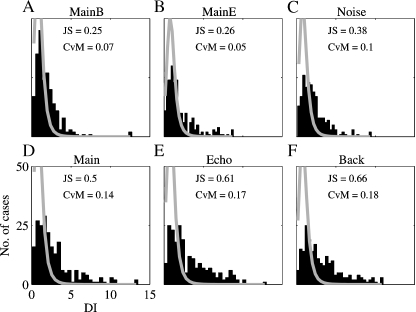
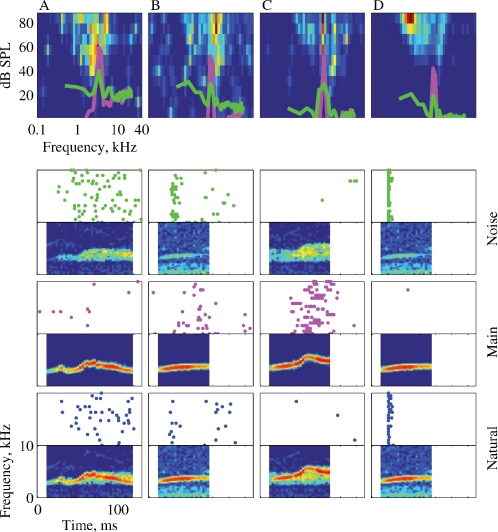
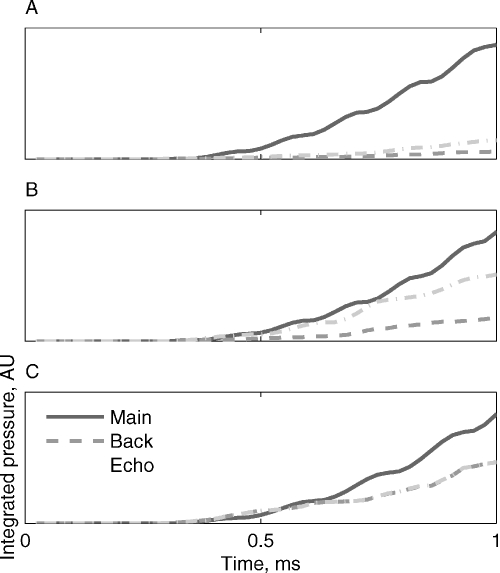
Animal vocalizations in natural settings are invariably accompanied by an acoustic background with a complex statistical structure. We have previously demonstrated that neuronal responses in primary auditory cortex of halothane-anesthetized cats depend strongly on the natural background. Here, we study in detail the neuronal responses to the background sounds and their relationships to the responses to the foreground sounds. Natural bird chirps as well as modifications of these chirps were used. The chirps were decomposed into three components: the clean chirps, their echoes, and the background noise. The last two were weaker than the clean chirp by 13 and 29 dB on average respectively. The test stimuli consisted of the full natural stimulus, the three basic components, and their three pairwise combinations. When the level of the background components (echoes and background noise) presented alone was sufficiently loud to evoke neuronal activity, these background components had an unexpectedly strong effect on the responses of the neurons to the main bird chirp. In particular, the responses to the original chirps were more similar on average to the responses evoked by the two background components than to the responses evoked by the clean chirp, both in terms of the evoked spike count and in terms of the temporal pattern of the responses. These results suggest that some of the neurons responded specifically to the acoustic background even when presented together with the substantially louder main chirp, and may imply that neurons in A1 already participate in auditory source segregation.

Keywords: auditory cortex; cats; electrophysiology; natural sounds; single neurons.


Figures

Figure 1
Figure 1
The bird song stimuli and their modifications. Each version is represented both as an oscillogram and as a spectrogram. The frequency range for all spectrograms is 0–10 kHz. All spectrograms share the same color scale (covering a range of 60 dB), and all the oscillograms share the same scale. The time scale is identical for all versions of the same stimulus (in columns). The versions and their relationships are (from bottom to top): Natural (Main + Echo + Background), Main + Echo, Main + Background, Main, Noise (Echo + Background), Echo, and Background.
Figure 2
Figure 2
The initial 2 ms of Main, Echo, and Background (in black), overlaid on the corresponding waveform of Natural (in gray). The ordinate scales are given in A/D units, and are different for each version. In all the cases, Main is the dominant component starting from stimulus onset.
Figure 3
Figure 3
Calculation of the DI. A and B are two examples of a χ2 test. The left column displays responses to 20 presentations of Natural and of Main Background, and their superposition, Common. The right column represents the PSTHs computed using the non-uniform bins selected as described in the text. The bars are the spike counts per bin displayed at the end point of each bin, and the gray line is the PSTH, computed by dividing the spike counts per bin by the bin duration. Scales are the same in all panels.
Figure 4
Figure 4
The responses of three neurons to the seven versions of Stimulus-3. The FRAs of the neurons are displayed in the top row (BFs: A – 2.6, B – 3.9, and C – 5.2). Each FRA is based on the responses to 45 frequencies (equally spaced on a logarithmic scale between 0.1 and 40 kHz) and 11 levels (Linearly spaced on a logarithmic scale between about 0 and 87 dB SPL). The color scale represents firing rate, where blue is 0 and red is the maximal rate of each FRA: A – 142, B – 184, and C – 285 sp/second. The power spectra of Main (magenta) and Noise (green) at the actual level in which they were presented are plotted on top of the FRA. The left column represents the spectrograms of the versions of Stimulus-3. The responses to each version are displayed as a raster plot and as a peristimulus time histogram (PSTH). The PSTHs have been smoothed with a 10 ms hamming window. All PSTHs in a column share the same scale (A – 319, B – 80, and C – 126 sp/second). The rasters of the responses to Main and to Noise are plotted with the color used to represent their power spectrum.
Figure 5
Figure 5
The responses of a neuron to the 7 versions of Stimulus-1, 3, and 5. Same conventions as in Figure 4. The BF was 5.3 kHz and maximal firing rate in the FRA is 133 sp/second. The PSTHs are normalized to 105 sp/second. The power spectrum of Stimulus-5 is plotted on top of the FRA.
Figure 6
Figure 6
The responses of a neuron to all versions of stimuli 2, 3, and 4. Same conventions as in Figure 5. The BF is 4.7 kHz. The maximal firing rate of the FRA is 260 sp/second. The PSTHs are normalized to 130 sp/second in all the cases. The power spectrum of Stimulus-3 is plotted on top of the FRA.
Figure 7
Figure 7
Topographical distributions of the responses. (A) BF maps for the two mapping experiments. Scale bars are 0.5 mm. (B) Responses to three versions of Stimulus-1 at two sound levels in one cat. The magenta line represents the 7 kHz isofrequency contour. (C) Responses to three versions of Stimulus-3 at two sound levels in the same cat as B. Same conventions as B.
Figure 8
Figure 8
Quantitative analysis of the responses in the mapping experiments. (A, B) Percentages of large responses in the two mapping experiments, for stimuli 2 and 3. The middle bar (dark gray), representing the fraction of large responses to Natural, is always at 50%, the selected breakpoint between large and small responses. The two left bars in each group (black) represent the large responses to Main Echo and Main, the other two stimuli in the mapping experiments that contained the Main component. The two right bars in each group (light gray) represent the large responses to Noise and Background, the two stimuli in the mapping experiments that did not contain the Main component. (C). Average correlation coefficients between the response maps to Natural and to the other four stimulus versions used in the mapping experiments. Dotted line: maps at 35 dB, continuous line: maps at 65 dB. The error bars represent standard deviations.
Figure 9
Figure 9
The adjusted correlations between the spectral overlaps of the stimuli with the FRAs and the observed responses. (A) the distribution of the adjusted correlations. (B) the distribution of the adjusted correlations as a function of BF. In both A and B, white bars represent the number of significant correlations and gray bars on top of the white bars are the number of non-significant correlations.
Figure 10
Figure 10
Scatter plots of the responses to Natural against the responses to all other stimulus versions, for the whole neuronal population. The correlation coefficient was adjusted for the effects of neurons, stimuli, and versions. The adjusted correlation is shown in each plot. The responses of the examples presented in Figure 4 are marked by the following symbols: A – circle, B – star, and C – square. The gray bars on these points are one standard error long.
Figure 11
Figure 11
Scatter plots of the responses to Natural against the predictions of the linear regression equations. The linear regression coefficients were computed using the entire neuronal population. The equation of the linear regression is shown on top of each plot. The correlation coefficient between the resulting predictions and the actual responses is shown in each plot; it is adjusted for the effects of neurons, stimuli and versions. Na, me, mb, ma, no, ec, and ba represent the normalized responses to Natural, Main Echo, Main Background, Main, Noise, Echo, and Background respectively.
Figure 12
Figure 12
The distribution of the DI between Natural and all other versions. The histograms are the distribution of the DIs between the responses to six versions of all the stimuli and the responses to Natural. The gray line is the expected distribution under the null hypothesis of similarity between the responses. The distances between the observed and the expected distribution are indicated in the right corner. JS – Jensen-Shannon statistics and CVM – Cramer-von Mises statistics.
Figure 13
Figure 13
The responses of four neurons to Natural, Main, and Noise. The panels are arranged as in Figure 4. The BF, FRA maximal rate, and the stimulus are: A – 2.3 kHz, 65 sp/second, Stimulus-1; B – 5.2 kHz, 68 sp/second, Stimulus-5; C – 5.9 kHz, 83 sp/second, Stimulus-3; and D – 5.2 kHz, 262 sp/second, Stimulus-5.
Figure 14
Figure 14
Integrated pressure, the main determinant of first spike latency according to Heil and Neubauer (2003). A. Stimulus-2. B. Stimulus-3. C. Stimulus-5. First spike latency should occur at a fixed integrated pressure value, predicting substantially longer first spike latencies for the Echo and Background versions relative to the Main version of Stimulus-2; comparable latencies for Main and Echo but longer latencies for Background of Stimulus-3; and possible comparable latencies for the three versions of Stimulus-5.

References

    1. Bar-Yosef O., Rotman Y., Nelken I. (2002). Responses of neurons in cat primary auditory cortex to bird chirps: effects of temporal and spectral context. J. Neurosci. 22, 8619–8632 - PMC - PubMed
    1. Bizley J. K., Nodal F. R., Nelken I., King A. J. (2005). Functional organization of Ferret auditory cortex. Cereb. Cortex. - PubMed
    1. Creutzfeldt O., Hellweg F. C., Schreiner C. (1980). Thalamocortical transformation of responses to complex auditory stimuli. Exp. Brain Res. 39, 87–104 - PubMed
    1. Famoye F. (2000). Goodness-of-fit tests for generalized logarithmic series distribution. Comput. Stat. Data Analysis 33, 59–67
    1. Gehr D. D., Komiya H., Eggermont J. J. (2000). Neuronal responses in cat primary auditory cortex to natural and altered species-specific calls. Hear. Res. 150, 27–42 - PubMed