. 2007 Nov 2:1:2.
doi: 10.3389/neuro.04.002.2007. eCollection 2007.

Estimating firing rates from calcium signals in locust projection neurons in vivo

Affiliations

Estimating firing rates from calcium signals in locust projection neurons in vivo

Laurent Moreaux et al. Front Neural Circuits. .

Abstract

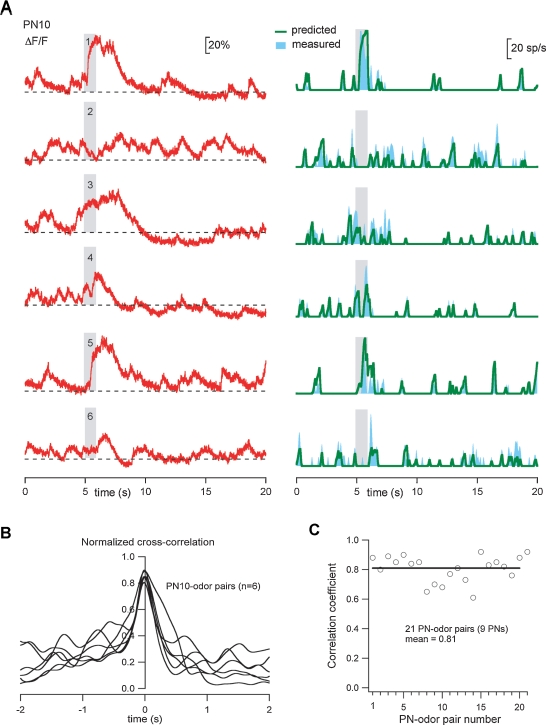
Combining intracellular electrophysiology and multi-photon calcium imaging in vivo, we studied the relationship between calcium signals (sampled at 500-750 Hz) and spike output in principal neurons in the locust antennal lobe. Our goal was to determine whether the firing rate of individual neurons can be estimated in vivo with calcium imaging and, if so, to measure directly the accuracy and resolution of our estimates. Using the calcium indicator Oregon Green BAPTA-1, we describe a simple method to reconstruct firing rates from dendritic calcium signals with 80-90% accuracy and 50 ms temporal resolution.

Keywords: Oregon Green BAPTA-1; calcium imaging; electrophysiology; locust; olfaction; projection neuron; spiking activity; two-photon microscopy.


Figures

Figure 1
Figure 1
In vivo two-photon imaging of the calcium indicator OGB-1 in locust projection neurons (PNs). (A) Frontal view of a PN labeled from a secondary dendrite via the recording electrode (el.). Eleven of the PN's 12 glomerular tufts can be seen, forming a circle in one plane. The soma and axon, respectively above and below the dendritic plane, are not included in this projection. (B) Side projection of a different PN, showing the soma (top left; typically on the antenna lobe's frontal surface), the plane of glomerular projections (view orthogonal to that in A), and part of the axon (pointing down). Fluorescence intensity was kept roughly constant over the image depth by tuning the laser excitation intensity. (C) Simultaneous voltage (Vm) and OGB-1-imaging (ΔF/F, 500 Hz) recorded after dye injection into the soma (PN different from those in A–B): no significant changes in calcium signal could be induced by odor-evoked activity or current injection. (D) Dendritic impalement configuration typical for simultaneous calcium imaging and voltage recording (PN different from those in A–C): within 10 minutes of impalement, one or several tufts could be seen (box 1); a 30 × 30 μm2 area was then selected for line scans (stippled line, box 2).
Figure 2
Figure 2
Simultaneous glomerular-calcium imaging and dendritic recording in PNs in vivo. (A–C) Single 24 second-long trials (16 seconds shown), each with a different PN and odor stimulus (indicated by vertical gray band). Top: xt-scan across one glomerular tuft (30 μm × 16 seconds); middle: corresponding ΔF/F (500-Hz sampling); bottom: intracellular membrane potential (Vm; 15 kHz sampling). Stippled line: average baseline fluorescence before odor pulse. Note subthreshold components of PN voltage and corresponding ΔF/F deflections (asterisks), and non-exponential decay of ΔF/F after cessation of firing (triangles).
Figure 3
Figure 3
Calcium signal dynamics upon odor presentation and intracellular current injection. (A) Two successive trials with odor cineole (15 seconds of the 24 acquired for each trial are displayed) illustrating (i) the elevated baseline fluorescence (corresponding to a mean baseline firing rate of 5 sp/second, typical for PNs), (ii) the odor-evoked fluorescence modulation (mostly below baseline in this example), and (iii) inter-trial response reliability. Current pulses (top: positive; bottom: negative) were injected toward the end of each trial, to evaluate the dynamic range of the fluorescence signal. F0: minimum fluorescence, reached here during both odor- and pulse-evoked hyperpolarizations. Stippled line: mean baseline fluorescence, determined before odor pulse. (B) Same PN, held slightly hyperpolarized by constant current (Ih) to minimize mean baseline fluorescence: depolarizing current pulse injection evokes calcium signal summation to level comparable to that in A (top). This indicates that PN baseline F in vivo is high.
Figure 4
Figure 4
Calcium signals are not always correlated with spiking. (A) Seven glomeruli were successively imaged in this PN, using constant odor delivery conditions. Single trials of Vm and F responses evoked by 1-second pulse of cherry odor are shown for four glomerular tufts (four colors). PN was held very slightly hyperpolarized. Note consistency of early F and V responses across glomeruli, to be contrasted with lack of correlation between F (linearly quantified as a rate r ± SD) in silent phase of the response and spiking response in preceding moments (in number of APs, B; or rate, C). (D) A different PN, held slightly hyperpolarized, in which F is revealed to vary substantially even with subthreshold event (*).
Figure 5
Figure 5
PN glomerular fluorescence after blockade of nicotinic synaptic input with mecamylamine. Odor delivery failed to depolarize the PN and baseline activity was close to 0 sp/second. (A) Current-evoked spike trains lead to clear summation of F transients, but current-evoked hyperpolarization leads to no further decrease in F, indicating that baseline PN fluorescence in intact animals is elevated because of tonic synaptic depolarization. (B) Spike-evoked calcium transients (single event: thin line; spike-triggered average (STA) of seven events: thick line) with decay time constant (τ = 50 ± 7 ms). (C) Upon large current injection, causing fast PN depolarization, F increases prior to the first action potential, indicating low-voltage-gated calcium entry, consistent with high baseline fluorescence in intact animals.
Figure 6
Figure 6
Prediction of one PN's firing profile from its glomerular calcium signals alone. (A) Using the rules described in the text, we use the Gaussian-smoothed ΔF/FB trace (dark red) to estimate the PN's discharge with ∼50 ms resolution. Stippled line indicates FB (note that FB ≠ F0). Compare predicted, smoothed firing rate (green trace) with that calculated by 50-ms-Gaussian smoothing (blue trace) of actual spike discharge obtained from intracellular trace (Vm). X, Y: see B; M, FP: see E. (B) The proportionality constant S between firing rate and calcium-plateau, used as a fixed scaling parameter in our method (see text), was extracted from 5 PNs (16-second-long single trials, 1-second odor presentation), each exhibiting moderate firing rate modulations (below 40 sp/second) upon stimulation. X and Y mark the spike-related peak amplitudes of, respectively, measured and predicted-smoothed firing rates (as illustrated in A). (C) Dispersion from assumed linearity of Y(X), shown for PN4. (D) Cross-correlation (normalized to autocorrelation of measured firing rate) between estimated and measured firing rates; this measure is used as a global accuracy estimator of our predictions: PN4 prediction captures almost 90% of the actual firing rate. A perfect prediction would yield a peak at 1.0. (E) Match between predicted and measured firing rate peaks was also assessed piecewise; percentage of missed (M) and false positive (FP) events was measured (see examples in A). FP events are less than 5% of the total number of real events (n).
Figure 7
Figure 7
Firing rate prediction from ΔF/F as applied to three different PNs. (A–C) Left: raw and smoothed (red and dark red) fluorescence traces (ΔF/FB), predicted (smoothed) firing rate (green), measured (smoothed) firing rate (blue). Right: assessment of match between estimated and measure rates; top: normalized cross-correlation; bottom: proportions of missed and false positive events. In each example, 15 seconds of 24-second-long, single trials are shown. The only experiment-specific parameter is FB (dashed lines), measured as minimum calcium signal before the odor presentation; FB thus requires no manipulation of membrane potential, and is not the same as F0. All other parameters (S, Tc, and the threshold; see text and next figure) are fixed and identical for all. Note high accuracy for predicted firing for PN7 and small false positive percentage for all three examples.
Figure 8
Figure 8
Empirical assessment of firing threshold value (see text) that minimizes the sum of missed and false positive events (M + FP). Different thresholds are tested (green traces) and compared with the firing rate profile (blue) measured. The PNs in A and B are chosen because they illustrate two extremes of PN activity patterns (A: sparse firing, large subthreshold potential variations; B: high and variable resting activity). Because the threshold is a fixed parameter, it should be optimized such that reconstruction accuracy is maximized over all PNs. (A) Following odor presentation, PN8 undergoes many successive subthreshold potential variations, leading to a large proportion of false positive events in the prediction from ΔF/F. A threshold of 8 sp/second would be optimal for this neuron. (B) By contrast, PN9 displays a high and irregular spike discharge both at rest and after odor stimulation, causing very few false positive events. A high threshold, however, leads to many missed events. A threshold of 2 sp/second would be optimal for this neuron. After similar analysis with several PNs, the threshold parameter was set at 4 sp/second; this value represents a trade-off between missing and erroneously detecting spiking events, when assessed over a large span of PN firing patterns.
Figure 9
Figure 9
Reliability of firing-rate prediction over various stimuli and response patterns. (A) Comparison of predicted (green) and measured (cyan) smoothed firing rates. All plots are from single-trials, with the same PN (PN10), and six odors (1: cis-3-hexen-1-ol, 50%; 2:1-hexanol, 50%; 3: benzaldehyde, 50%; 4: benzaldehyde, 0.5%; 5: isoamylacetate, 50%; 6: isoamylacetate, 0.5%). Corresponding raw fluorescence traces (red) are juxtaposed, to emphasize the difference between calcium signals and spike discharge. (B) Normalized cross-correlations between predicted and measured (50 ms-Gaussian smoothing) rates for the six trials in A. Peak correlations are between 0.80 and 0.90. (C) Measure of peak cross-correlation (at dt = 0, as in B) for 21 PN-odor pairs calculated with 9 PNs. These correlations are calculated over the entire duration of each trial, and thus represent both stimulus-evoked and spontaneous activity, as shown in A. In all cases, the only trial-specific parameter is FB (minimum fluorescence during pre-stimulus baseline); all other parameters are fixed and identical (see text).

References

    1. Bicker G. (1999). Histochemistry of classical neurotransmitters in antennal lobes and mushroom bodies of the honeybee. Microsc. Res. Tech. 45, 174–183 - PubMed
    1. Brustein E., Marandi N., Kovalchuk Y., Drapeau P., Konnerth A. (2003). “In vivo” monitoring of neuronal network activity in zebrafish by two-photon Ca(2+) imaging. Pflugers Arch. 446, 766–773 - PubMed
    1. Buck L., Axel R. (1991). A novel multigene family may encode odorant receptors: a molecular basis for odor recognition. Cell 65, 175–187 - PubMed
    1. Buzsaki G. (2004). Large-scale recording of neuronal ensembles. Nat. Neurosci. 7, 446–451 - PubMed
    1. Carlsson M. A., Knusel P., Verschure P. F., Hansson B. S. (2005). Spatio-temporal Ca2+ dynamics of moth olfactory projection neurones. Eur. J. Neurosci. 22, 647–657 - PubMed

LinkOut - more resources