. 2008 Oct 23:5:46.
doi: 10.1186/1742-2094-5-46.

Interleukin-1beta and tumor necrosis factor-alpha are expressed by different subsets of microglia and macrophages after ischemic stroke in mice

Affiliations

Interleukin-1beta and tumor necrosis factor-alpha are expressed by different subsets of microglia and macrophages after ischemic stroke in mice

Bettina H Clausen et al. J Neuroinflammation. .

Abstract

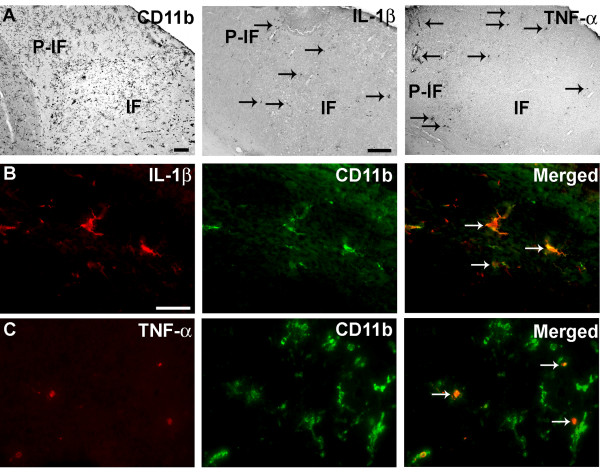
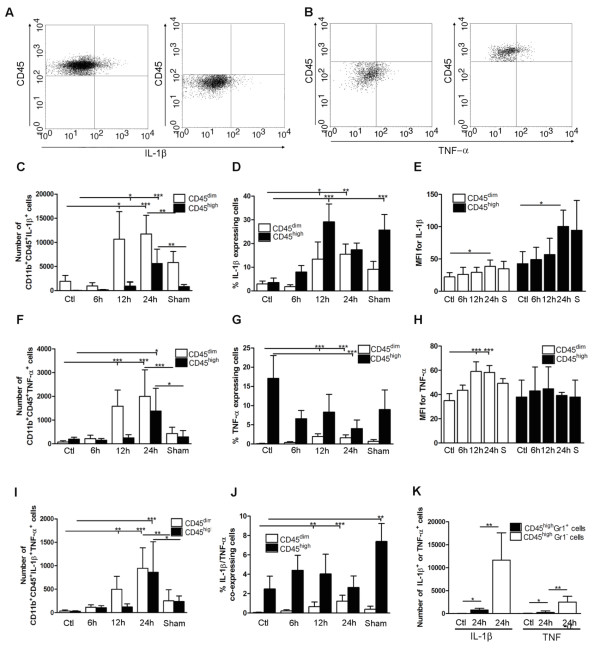
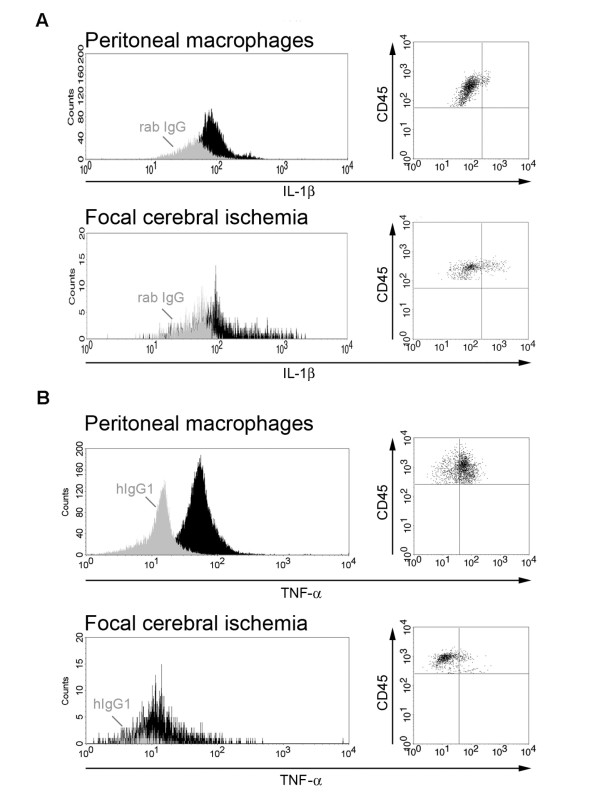
Background: Interleukin-1beta (IL-1beta) and tumor necrosis factor-alpha (TNF-alpha) are expressed by microglia and infiltrating macrophages following ischemic stroke. Whereas IL-1beta is primarily neurotoxic in ischemic stroke, TNF-alpha may have neurotoxic and/or neuroprotective effects. We investigated whether IL-1beta and TNF-alpha are synthesized by overlapping or segregated populations of cells after ischemic stroke in mice.

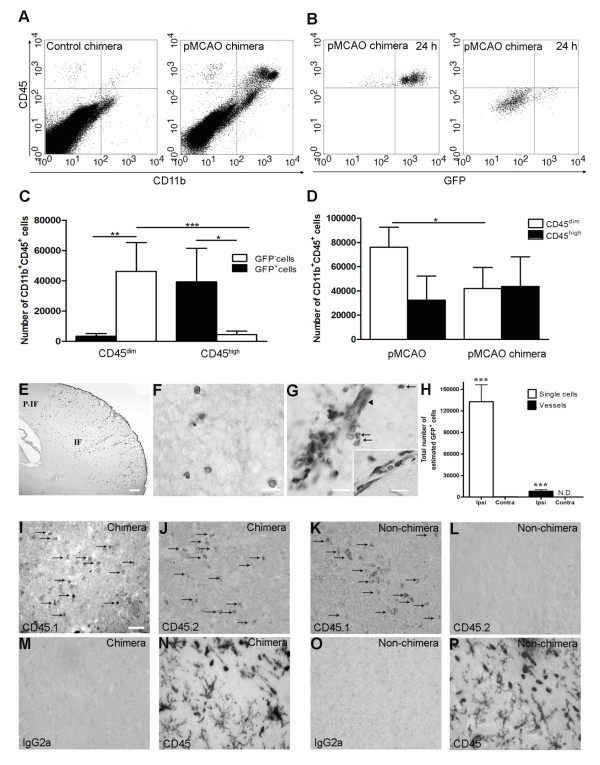
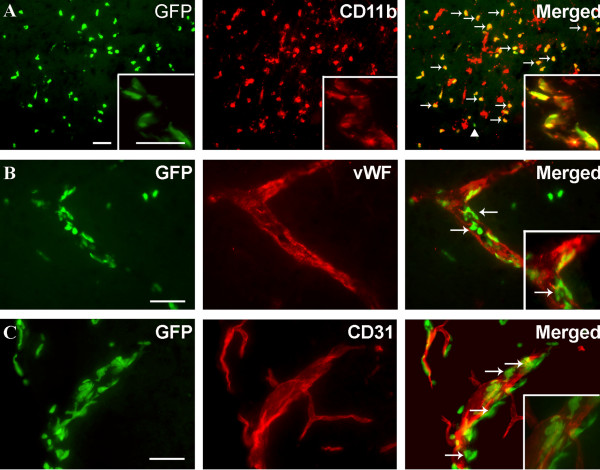
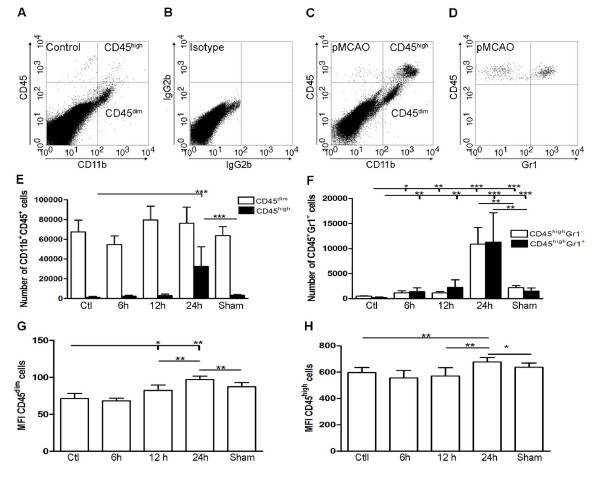
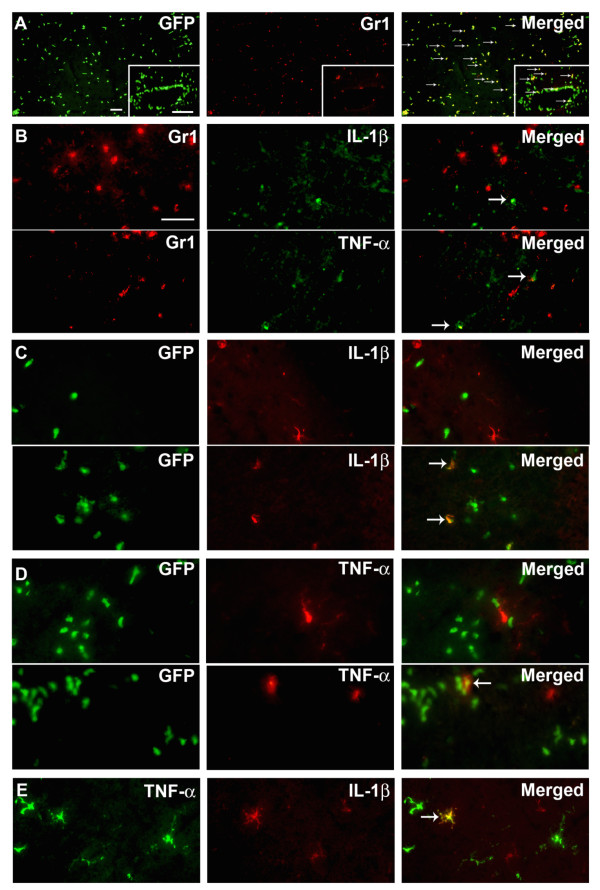
Methods: We used flow cytometry and immunohistochemistry to examine cellular co-expression of IL-1beta and TNF-alpha at 6, 12 and 24 hours after permanent middle cerebral artery occlusion in mice, validating the results by the use of bone marrow chimeric mice.

Results: We found that IL-1beta and TNF-alpha were expressed in largely segregated populations of CD11b+CD45dim microglia and CD11b+CD45high macrophages, with cells expressing both cytokines only rarely. The number of Gr1+ granulocytes producing IL-1beta or TNF-alpha was very low, and we observed no IL-1beta- or TNF-alpha-expressing T cells or astrocytes.

Conclusion: Taken together, the results show that IL-1beta and TNF-alpha are produced by largely segregated populations of microglia and macrophages after ischemic stroke in mice. Our findings provide evidence of a functional diversity among different subsets of microglia and macrophages that is potentially relevant to future design of anti-inflammatory therapies in stroke.


Figures

Figure 1
Figure 1
Co-expression of IL-1β or TNF-α with CD11b+ cells. Cortical infarction 24 hours after pMCAO leads to expression of IL-1β and TNF-α in activated CD11b+ microglia and macrophages/granulocytes. (A) Distribution of CD11b+, IL-1β+ and TNF-α+ cells in infarct (IF) and peri-infarct (P-IF) regions. IL-1β+ (B) and TNF-α+ (C) cells were particularly numerous at the edge of the infarct, and these cytokines were exclusively expressed by CD11b+ cells (arrows). CD11b+ cells were visualized using Alexa Fluor® 488-conjugated goat anti-rat IgG, IL-1β+ and TNF-α+ cells using Alexa Fluor® 594-conjugated donkey anti-rabbit IgG. Scale bars: 200 μm (A), 20 μm (B, C).
Figure 2
Figure 2
Infiltration of GFP+ BM-cells in infarct and peri-infarct regions. (A-B) Dot plots of viable macrophages/granulocytes (CD11b+CD45high, top right quadrants) and microglia (CD11b+CD45dim, bottom right quadrants) in cortex from BM-chimeric unmanipulated mice and mice exposed to pMCAO. (C) Bar graph showing mean numbers of CD11b+CD45dim microglia and CD11b+CD45high macrophages/granulocytes in BM-chimeric mice 24 hours after pMCAO, subdivided based on expression of GFP (n = 5). Approximately 92% of of the CD45high population were GFP+ . (D) Estimation and comparison of mean numbers of CD11b+CD45dim microglia in non-chimeric (n = 10) versus BM-chimeric mice (n = 5) 24 hours after of pMCAO shows significantly fewer CD11b+CD45dim microglial cells in irradiated mice. (E) Overview, showing distribution of infiltrating GFP+ BM-derived cells into infarct (IF) and peri-infarct (P-IF) regions 24 hours after pMCAO. (E-G) By 24 hours, GFP+ single cells (F) and vessel-associated aggregates of GFP+ cells (arrows in G) were observed in infarct and peri-infarct regions. Some of the vessel-associated cells were round, leukocyte-like cells (arrows) while others were elongated cells lining the vasculature (arrow heads in G and in insert). (H) Bar graph showing mean numbers of single GFP+ cells and vessel-associated aggregates of GFP+ cells in ipsi- and contralateral cortex 24 hours after surgery (n = 10). (I-P) Immunohistochemical staining of CD45.1 (I, K), CD45.2 (J, L), IgG2a (M, O) and CD45 (N, P) in ischemic tissue in BM-chimeric (I, J, M, N) and non-chimeric mice (K, L, O, P) 24 hours after pMCAO. N.D, none detected. Scale bars: 200 μm (A), 10 μm (B, C). 50 μm (I-P) *P < 0.05, **P < 0.01, and ***P < 0.001.
Figure 3
Figure 3
BM-derived GFP+ single cells and vessel-associated cells express CD11b. Fluorescence microscopy for GFP combined with immunofluorescence detection of (A) CD11b, (B) vWF and (C) CD31, 24 hours after pMCAO. (A) Fluorescence detection of GFP and CD11b showed that most GFP+ cells co-expressed CD11b (yellow cells, indicated by arrows), and intermingled with CD11b+ host cells. Note also that a few GFP+ cells did not co-express CD11b (arrow head). Insert shows high magnification of GFP+ cells, some of which co-express CD11b, aggregated around a vessel. (B, C) Fluorescence detection of GFP and the endothelial cell markers vWF (B) and CD31 (C). Inserts show higher magnification of sections of the same vessels. Although there are indications that single vWF+ cells co-express GFP (arrows in B), this could not be reproduced using staining for CD31, and the majority of vWF+ and CD31+ cells showed no co-expression of GFP. Instead, GFP remained confined to round and elongated cells located in the juxtavascular space (insert in C). CD11b+ cells were visualized using Alexa Fluor® 568-conjugated goat anti-rat IgG, vWF+ and CD31+ cells using Alexa Fluor® 546-conjugated goat anti-rabbit IgG and Alexa Fluor® 594-conjugated goat anti-rat IgG, respectively. Scale bars: 20 μm (A-C).
Figure 4
Figure 4
Inflammatory response following permanent MCA occlusion. (A-C) Dot plots of viable CD11b+CD45high macrophages/granulocytes (top right quadrants) and CD11b+CD45dim microglia (bottom right quadrants) in cortex from unmanipulated control mice (A, B), and mice exposed to pMCAO with 24 hour survival (C). (D) At 24 hours, flow cytometric analysis of the CD11b+CD45high profiles showed that approximately half of the population consisted of CD45highGr1+ granulocytes. (E) Quantification of CD11b+CD45dim and CD11b+CD45high cells in unmanipulated control mice (n = 10), in mice 6 (n = 7), 12 (n = 7), or 24 hours after pMCAO (n = 10), and in sham-operated mice 24 hours after pMCAO (n = 7). (F) Bar graphs showing equal recruitment of CD11b+CD45highGr1- macrophages and CD11b-CD45highGr1+ granulocytes in unmanipulated mice, in mice 6, 12, or 24 hours after pMCAO, and in sham-operated mice 24 hours after pMCAO. (G, H) Bar graphs showing the mean fluorescent intensity (MFI) of CD45 expression by CD45dim microglia (G) and CD45high macrophages/granulocytes (H). *P < 0.05, **P < 0.01, and ***P < 0.001.
Figure 5
Figure 5
Cytokine expression in segregated populations of cells following stroke. (A, B) Dot plots showing CD11b+CD45high macrophages/granulocytes (upper right quadrants) and CD11b+CD45dim microglia (bottom right quadrants) expressing IL-1β (A) or TNF-α (B). (C-J) Bar graphs showing numbers and proportions of IL-1β (C, D), TNF-α (F, G) and IL-1β/TNF-α co-expressing (I, J) CD11b+CD45dim microglia and CD11b+CD45high macrophages/granulocytes in unmanipulated control mice (n = 10), in mice 6 (n = 7), 12 (n = 7), or 24 hours after pMCAO (n = 10), and in sham-operated mice 24 hours after pMCAO (n = 7). (E, H) Comparison of the MFI values for IL-1β (E) and TNF-α (H) in viable CD11b+CD45dim microglia and CD11b+CD45high macrophages/granulocytes in unmanipulated mice, in mice 6, 12, or 24 hours after pMCAO, and in sham-operated mice 24 hours after pMCAO. Macrophages/granulocytes express significantly more IL-1β than do microglial in unmanipulated mice, in mice 6, 12, or 24 hours after pMCAO, and in sham-operated mice 24 hours after pMCAO (E), whereas microglial cells express significantly higher levels of TNF-α than do macrophages/granulocytes at 12 h and 24 hours, and in sham-operated mice 24 hours after pMCAO (H). (K) CD11b+CD45highGr1- macrophages and not CD11b+CD45highGr1+ granulocytes are the main producers of IL-1β and TNF-α 24 hours after pMCAO. *P < 0.05, **P < 0.01, and ***P < 0.001.
Figure 6
Figure 6
Sensitivity of cytokine detection using flow cytometry. Histograms and dot plots of IL-1β (A) and TNF-α (B) expression in LPS-activated peritoneal macrophages versus macrophages/granulocytes isolated from cortex 24 hours after pMCAO. Light colored histograms represent cells stained with isotype control antibodies and filled histograms represent cells stained with antibodies for either IL-1β (A) or TNF-α (B).
Figure 7
Figure 7
IL-1β and TNF-α are expressed by macrophages and microglia. (A) Infiltrating GFP+ cells consist of Gr1+ granulocytes and Gr1- macrophages. (B) Double immunofluorescence for Gr1+ granulocytes and either IL-1β or TNF-α showed no detectable co-expression 24 hours after pMCAO. Immunofluorescence detection of GFP and IL-1β (C) or TNF-α (D) showed that these cytokines are expressed by resident GFP- microglia and infiltrating GFP+ macrophages (E) Immunofluorescence double staining confirmed the flow cytometry results by showing that IL-1β and TNF-α are expressed by largely segregated subpopulations of cells. Very few IL-1β+TNF-α+ co-expressing cells were identified during microscopic analysis (E). Gr1+ granulocytes were visualized using Alexa Fluor® 594-conjugated goat anti-rat IgG, and IL-1β+ and TNF-α+ cells using both Alexa Fluor® 488-conjugated goat anti-rabbit and chicken anti-rabbit IgG. Scale bars: 50 μm (A) 20 μm (insert, A), 20 μm (B-E).

References

    1. Boutin H, LeFeuvre RA, Horai R, Asano M, Iwakura Y, Rothwell NJ. Role of IL-1α and IL-1β in ischemic brain damage. J Neurosci. 2001;21:5528–5534. - PMC - PubMed
    1. Hallenbeck JM. The many faces of tumor necrosis factor in stroke. Nat Med. 2002;8:1363–1368. doi: 10.1038/nm1202-1363. - DOI - PubMed
    1. Schielke GP, Yang GY, Shivers BD, Betz AL. Reduced ischemic brain injury in interleukin-1β converting enzyme-deficient mice. J Cereb Blood Flow Metab. 1998;18:180–185. doi: 10.1097/00004647-199802000-00009. - DOI - PubMed
    1. Loddick SA, Rothwell NJ. Neuroprotective effects of human recombinant interleukin-1 receptor antagonist in focal cerebral ischaemia in the rat. J Cereb Blood Flow Metab. 1996;16:932–940. doi: 10.1097/00004647-199609000-00017. - DOI - PubMed
    1. Mulcahy NJ, Ross J, Rothwell NJ, Loddick SA. Delayed administration of interleukin-1 receptor antagonist protects against transient cerebral ischemia in the rat. Br J Pharmacol. 2003;140:471–476. doi: 10.1038/sj.bjp.0705462. - DOI - PMC - PubMed

Publication types

MeSH terms