

DNA damage in preserved specimens and tissue samples: a molecular assessment
- PMID: 18947416
- PMCID: PMC2579423
- DOI: 10.1186/1742-9994-5-18
DNA damage in preserved specimens and tissue samples: a molecular assessment
Abstract
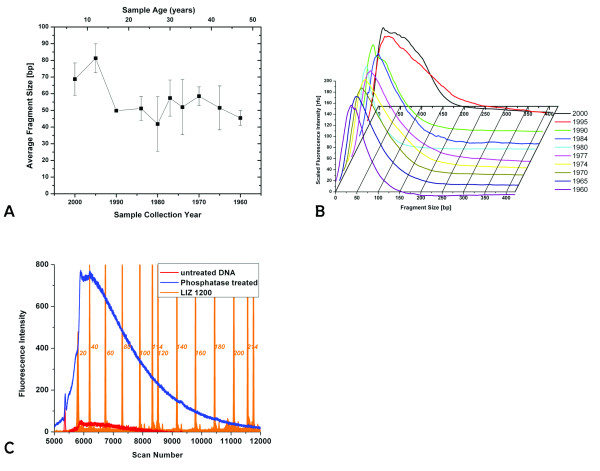
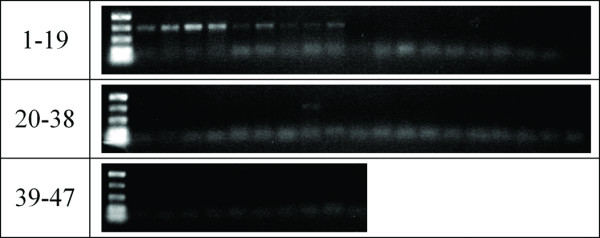
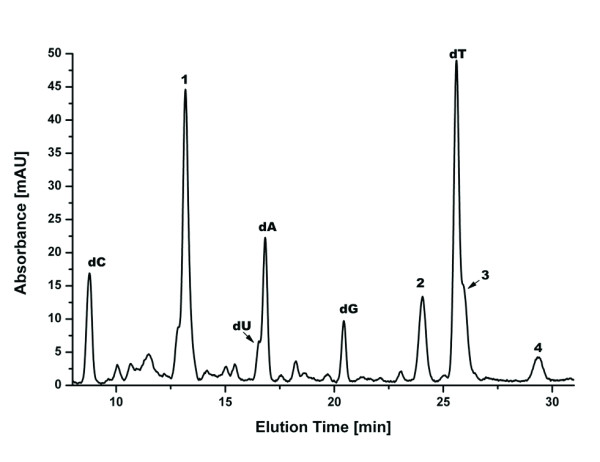
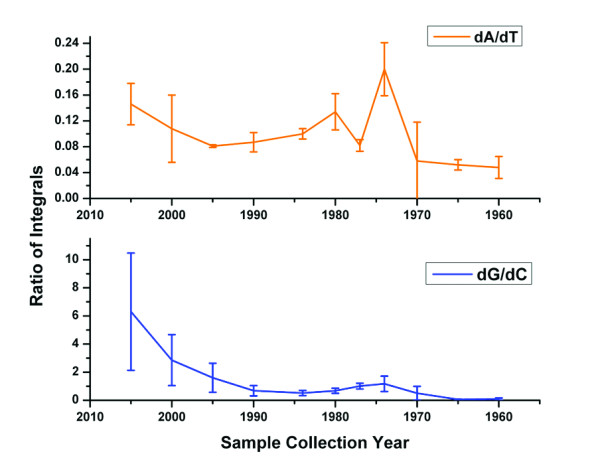
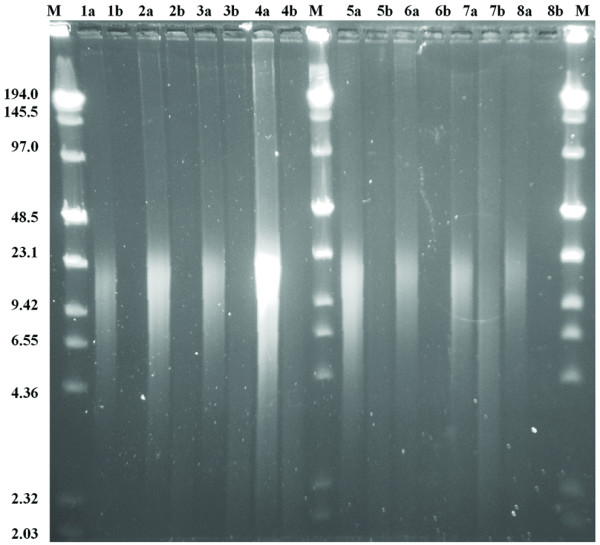
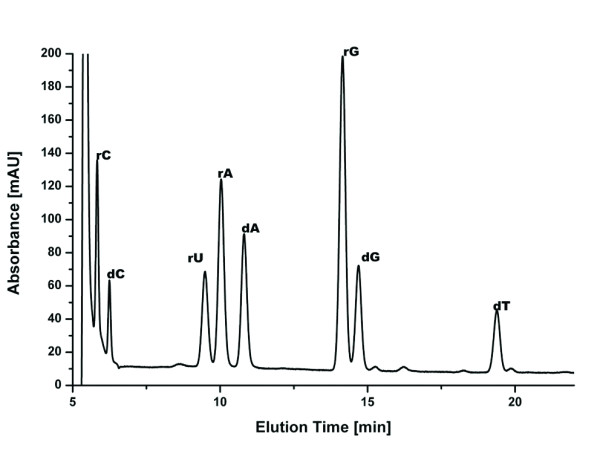
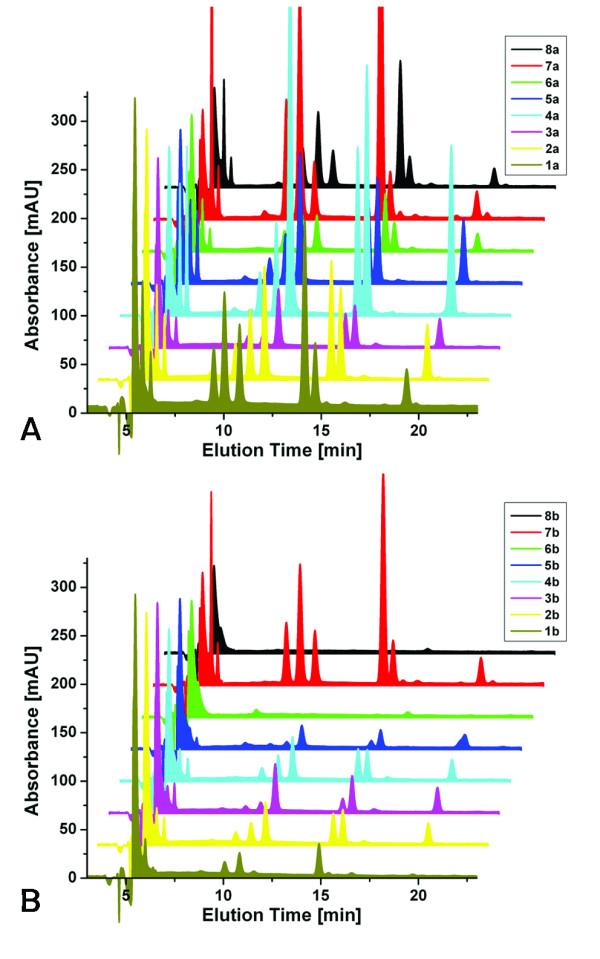
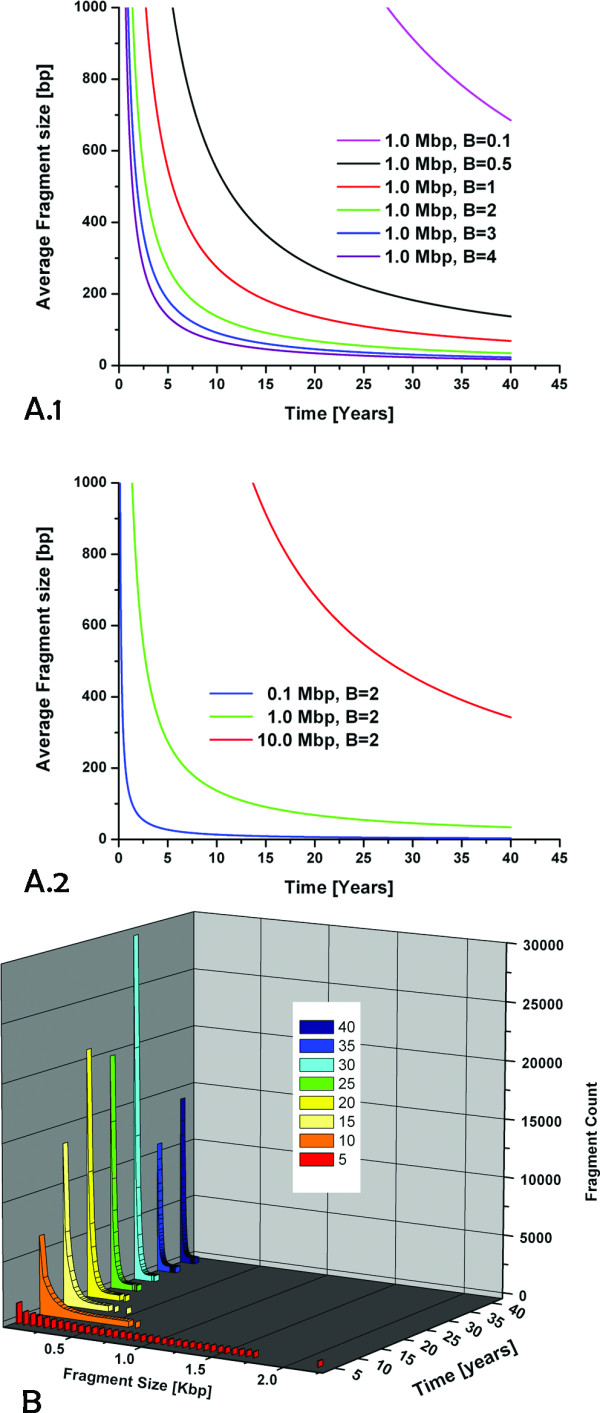
The extraction of genetic information from preserved tissue samples or museum specimens is a fundamental component of many fields of research, including the Barcode of Life initiative, forensic investigations, biological studies using scat sample analysis, and cancer research utilizing formaldehyde-fixed, paraffin-embedded tissue. Efforts to obtain genetic information from these sources are often hampered by an inability to amplify the desired DNA as a consequence of DNA damage.Previous studies have described techniques for improved DNA extraction from such samples or focused on the effect of damaging agents - such as light, oxygen or formaldehyde - on free nucleotides.We present ongoing work to characterize lesions in DNA samples extracted from preserved specimens. The extracted DNA is digested to single nucleosides with a combination of DNase I, Snake Venom Phosphodiesterase, and Antarctic Phosphatase and then analyzed by HPLC-ESI-TOF-MS.We present data for moth specimens that were preserved dried and pinned with no additional preservative and for frog tissue samples that were preserved in either ethanol, or formaldehyde, or fixed in formaldehyde and then preserved in ethanol. These preservation methods represent the most common methods of preserving animal specimens in museum collections. We observe changes in the nucleoside content of these samples over time, especially a loss of deoxyguanosine. We characterize the fragmentation state of the DNA and aim to identify abundant nucleoside lesions. Finally, simple models are introduced to describe the DNA fragmentation based on nicks and double-strand breaks.
Figures
Similar articles
-
Sequence capture phylogenomics of historical ethanol-preserved museum specimens: Unlocking the rest of the vault.Mol Ecol Resour. 2019 Nov;19(6):1531-1544. doi: 10.1111/1755-0998.13072. Epub 2019 Sep 18. Mol Ecol Resour. 2019. PMID: 31448547
-
Fixing Formalin: A Method to Recover Genomic-Scale DNA Sequence Data from Formalin-Fixed Museum Specimens Using High-Throughput Sequencing.PLoS One. 2015 Oct 27;10(10):e0141579. doi: 10.1371/journal.pone.0141579. eCollection 2015. PLoS One. 2015. PMID: 26505622 Free PMC article.
-
Assessment of alternatives to environmental toxic formalin for DNA conservation in biological specimens.Environ Sci Pollut Res Int. 2017 Jul;24(20):16985-16993. doi: 10.1007/s11356-017-9349-y. Epub 2017 Jun 3. Environ Sci Pollut Res Int. 2017. PMID: 28580543
-
Proteomic studies of formalin-fixed paraffin-embedded tissues.Expert Rev Proteomics. 2013 Apr;10(2):165-77. doi: 10.1586/epr.13.3. Expert Rev Proteomics. 2013. PMID: 23573783 Review.
-
[How to handle unkown fluids in fluid-preserved collections : Cloudy prospects?].Pathologie (Heidelb). 2022 Aug;43(Suppl 1):125-129. doi: 10.1007/s00292-022-01138-5. Epub 2022 Oct 12. Pathologie (Heidelb). 2022. PMID: 36222924 Review. German.
Cited by
-
Human formalin-fixed paraffin-embedded tissues: an untapped specimen for biomonitoring of carcinogen DNA adducts by mass spectrometry.Anal Chem. 2013 May 7;85(9):4251-8. doi: 10.1021/ac400612x. Epub 2013 Apr 10. Anal Chem. 2013. PMID: 23550627 Free PMC article.
-
Deep silicification-assisted long-term preservation of structural and genomic information across biospecies: From micro to macro.Proc Natl Acad Sci U S A. 2024 Oct 15;121(42):e2408273121. doi: 10.1073/pnas.2408273121. Epub 2024 Oct 10. Proc Natl Acad Sci U S A. 2024. PMID: 39388268 Free PMC article.
-
Historic Museum Samples Provide Evidence for a Recent Replacement of Wolbachia Types in European Drosophila melanogaster.Mol Biol Evol. 2023 Dec 1;40(12):msad258. doi: 10.1093/molbev/msad258. Mol Biol Evol. 2023. PMID: 37995370 Free PMC article.
-
New Molecular Phylogenetic Evidence Confirms Independent Origin of Coxal Combs in the Families of the 'Cydnoid' Complex (Hemiptera: Heteroptera: Pentatomoidea).Insects. 2024 Oct 11;15(10):792. doi: 10.3390/insects15100792. Insects. 2024. PMID: 39452368 Free PMC article.
-
European minnows through time: museum collections aid genetic assessment of species introductions in freshwater fishes (Cyprinidae: Phoxinus species complex).Heredity (Edinb). 2020 Mar;124(3):410-422. doi: 10.1038/s41437-019-0292-1. Epub 2020 Jan 2. Heredity (Edinb). 2020. PMID: 31896822 Free PMC article.
References
-
- Wandeler P, Hoeck PE, Keller LF. Back to the future: museum specimens in population genetics. Trends Ecol Evol. 2007;22:634–642. - PubMed
-
- Stivers JT, Kuchta RD. DNA Damage and Repair. Chemical Reviews. 2006;106 - PubMed
-
- Lehmann U, Kreipe H. Real-time PCR analysis of DNA and RNA extracted from formalin-fixed and paraffin-embedded biopsies. Methods. 2001;25:409–418. - PubMed
-
- Lindahl T. Instability and decay of the primary structure of DNA. Nature. 1993;362:709–715. - PubMed
-
- Paabo S, Poinar H, Serre D, Jaenicke-Despres V, Hebler J, Rohland N, Kuch M, Krause J, Vigilant L, Hofreiter M. Genetic analyses from ancient DNA. Annu Rev Genet. 2004;38:645–679. - PubMed
LinkOut - more resources
Full Text Sources
