. 2008 Oct 23:8:108.
doi: 10.1186/1471-2229-8-108.

RACK1 genes regulate plant development with unequal genetic redundancy in Arabidopsis

Affiliations

RACK1 genes regulate plant development with unequal genetic redundancy in Arabidopsis

Jianjun Guo et al. BMC Plant Biol. .

Abstract

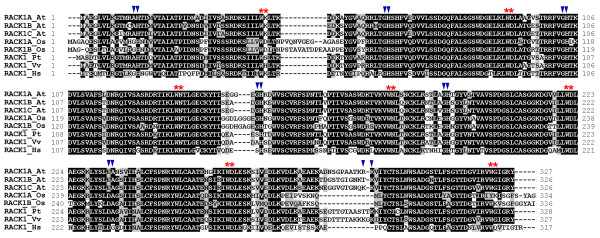
Background: RACK1 is a versatile scaffold protein in mammals, regulating diverse developmental processes. Unlike in non-plant organisms where RACK1 is encoded by a single gene, Arabidopsis genome contains three RACK1 homologous genes, designated as RACK1A, RACK1B and RACK1C, respectively. Previous studies indicated that the loss-of-function alleles of RACK1A displayed multiple defects in plant development. However, the functions of RACK1B and RACK1C remain elusive. Further, the relationships between three RACK1 homologous genes are unknown.

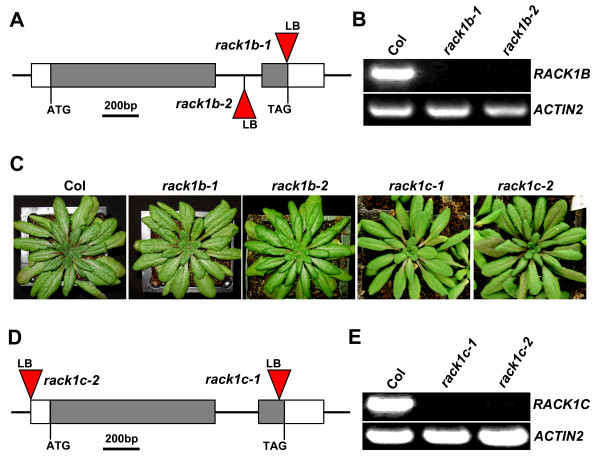
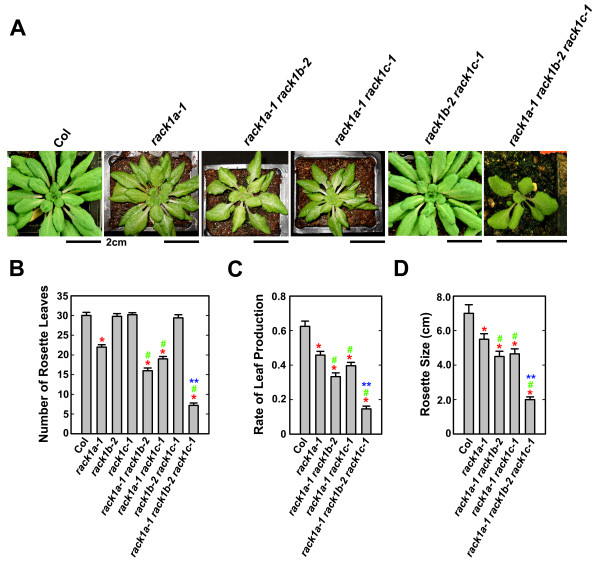
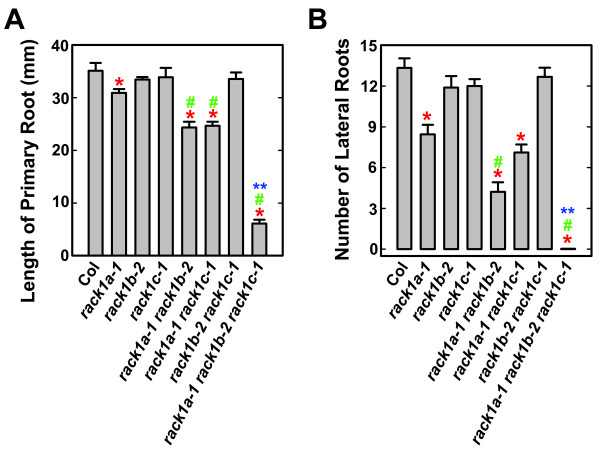
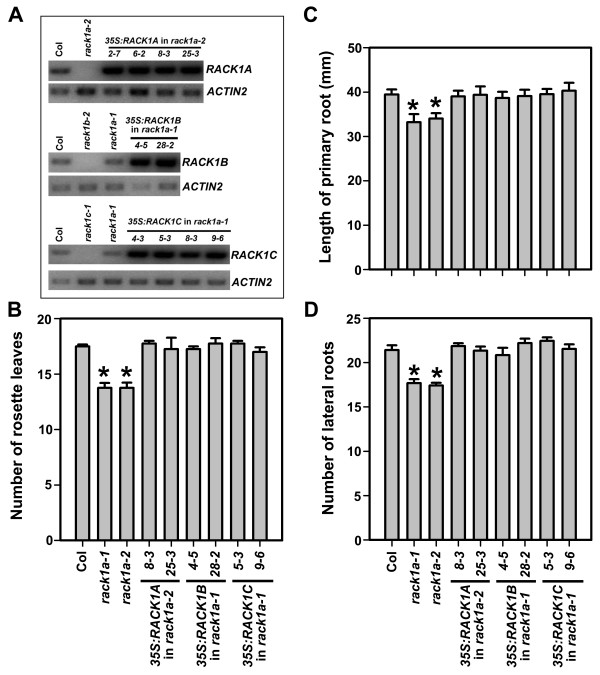
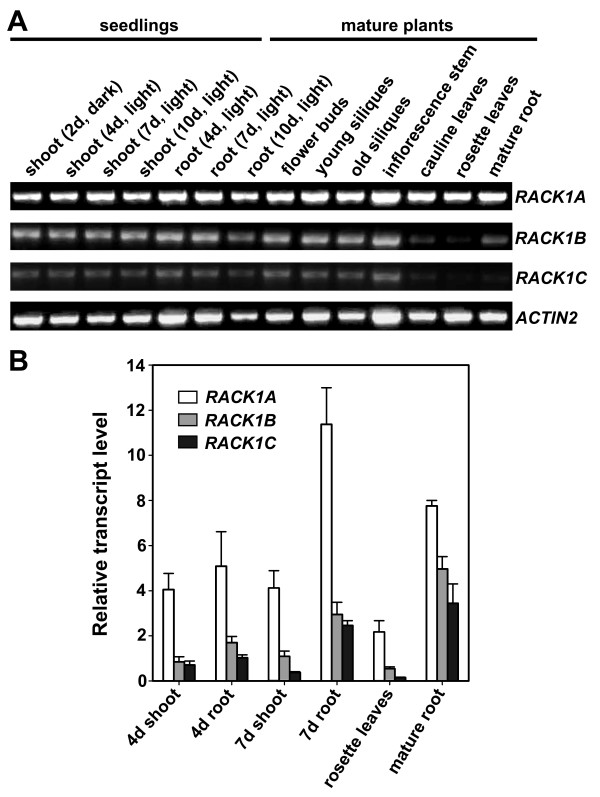
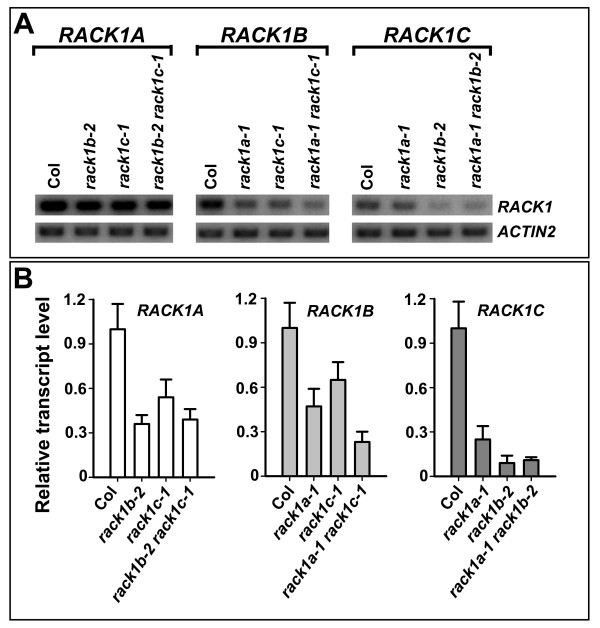
Results: We isolated mutant alleles with loss-of-function mutations in RACK1B and RACK1C, and examined the impact of these mutations on plant development. We found that unlike in RACK1A, loss-of-function mutations in RACK1B or RACK1C do not confer apparent defects in plant development, including rosette leaf production and root development. Analyses of rack1a, rack1b and rack1c double and triple mutants, however, revealed that rack1b and rack1c can enhance the rack1a mutant's developmental defects, and an extreme developmental defect and lethality were observed in rack1a rack1b rack1c triple mutant. Complementation studies indicated that RACK1B and RACK1C are in principle functionally equivalent to RACK1A. Gene expression studies indicated that three RACK1 genes display similar expression patterns but are expressed at different levels. Further, RACK1 genes positively regulate each other's expression.

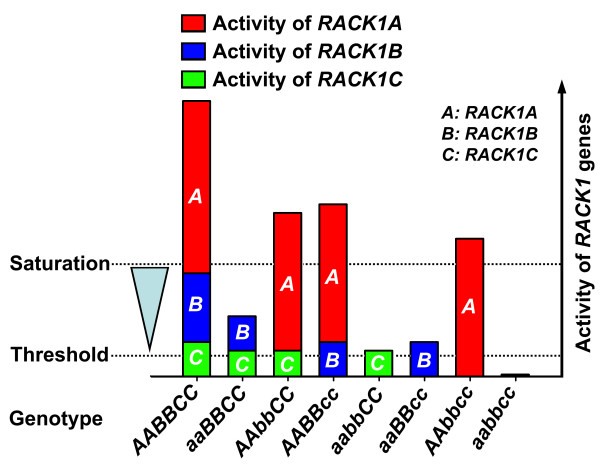
Conclusion: These results suggested that RACK1 genes are critical regulators of plant development and that RACK1 genes function in an unequally redundant manner. Both the difference in RACK1 gene expression level and the cross-regulation are likely the molecular determinants of their unequal genetic redundancy.


Figures

Figure 1
Figure 1
Multiple amino acid sequence alignment of RACK1 in plants and in humans. The amino acid sequences were aligned by CLUSTALW multiple alignment of BioEdit Sequence Alignment Editor . Amino acids that are identical or similar are shaded with black or gray, respectively. Gaps are shown as dashed lines. The proteins aligned are (name of species and accession number in parentheses): RACK1A_At (Arabidopsis thaliana, NP_173248), RACK1B_At (Arabidopsis thaliana, NP_175296), RACK1C_At (Arabidopsis thaliana, NP_188441), RACK1A_Os (Oryza sativa, NP_001043910), RACK1B_Os (Oryza sativa, NP_001056254), RACK1_Pt (Populus trichocarpa, ABK92879), RACK1 _Vv (Vitis vinifera, CAN61810), and RACK1_Hs (Homo sapiens, NP_006089). The positions of GH and WD dipeptides in each WD40 repeat are indicated by triangles and asterisks, respectively, on the top of residues. The positions for WD repeat domains were obtained from the SMART database .
Figure 2
Figure 2
T-DNA insertional mutants of RACK1B and RACK1C. (A) A diagram to illustrate the T-DNA insertion sites in rack1b-1 and rack1b-2 mutants. (B) RT-PCR analysis of RACK1B transcript in rack1b mutants. RACK1B-specific primers that amplify the full-length transcript of RACK1B in wild-type (Col) were used. (C) The rosette morphology of rack1b and rack1c mutants. Shown are plants grown 48 days under 10/14 h photoperiod. (D) A diagram to illustrate the T-DNA insertion sites in rack1c-1 and rack1c-2 mutants. (E) RT-PCR analysis of RACK1C transcript in rack1c mutants.RACK1C-specific primers that amplify the full-length transcript of RACK1C in Col were used. Gray boxes in (A) and (D) represent coding regions and white boxes represent 5'-UTR and 3'-UTR regions. The T-DNA inserts are not drawn to scale. LB, T-DNA left border. Total RNA isolated from 10 d-old, light-grown seedlings was used for RT-PCR analysis in (B) and (E). RT-PCR was performed with 30 cycles. The expression of ACTIN2 was used as a control.
Figure 3
Figure 3
rack1b-2 and rack1c-1 mutations enhance the rosette leaf phenotype of rack1a mutants. (A) The phenotype of rack1 mutants. Shown are plants grown for 48 days under 10/14 h photoperiod. Scale bars, 2 cm. (B) The number of rosette leaves of rack1 mutants. (C) The rate of rosette leaf production of rack1 mutants. The rate of rosette leaf production is expressed as the number of rosette leaves divided by the age of plants. (D) The size of rosette of rack1 mutants. The number of rosette leaves, the rate of rosette leaf production and the size of rosette were measured from plants grown for 48 d under 10/14 h photoperiod. Shown in (B) to (D) are the averages of at least four plants ± S.E. The same experiment was repeated twice with similar trends and the data from one experiment were presented. *, significant difference from Col, P < 0.05. #, significant difference from rack1a single mutant, P < 0,05. **, significant difference from rack1a-1 rack1b-2 double mutant, P < 0.05.
Figure 4
Figure 4
rack1b-2 and rack1c-1 mutations enhance the root phenotype of rack1a mutants. (A) The length of primary root of rack1 mutants. (B) The number of lateral roots of rack1 mutants. The length of primary root and the number of lateral roots were measured from 10 d-old, light-grown seedlings (under 14/10 h photoperiod). Shown are the averages of at least 15 seedlings ± S.E. *, significant difference from Col, P < 0.05. #, significant difference from rack1a single mutant, P < 0.05. **, significant difference from rack1a-1 rack1b-2 double mutant, P < 0.05.
Figure 5
Figure 5
The complementation of rack1a mutants by overexpression of RACK1 genes. (A) RT-PCR analysis of the expression of RACK1 genes in transgenic lines. The transgenic lines 2-7, 6-2, 8-3 and 25-3 are RACK1A overexpressors in rack1a-2 mutants. The transgenic lines 4-5 and 28-2 are RACK1B overexpressors in rack1a-1 mutants. The transgenic lines 4-3, 5-3, 8-3 and 9-6 are RACK1C overexpressors in rack1a-1 mutants. RT-PCR was performed at 28 cycles. The expression of ACTIN2 was used as a control. (B) The number of rosette leaves in transgenic plants overexpressing individual RACK1 gene in rack1a mutant background. The number of rosette leaves was collected from plants grown for 37 d under 14/10 h photoperiod. Shown are the averages of number of rosette leaves from at least four plants ± S.E. (C) The length of primary root in transgenic plants overexpressing individual RACK1 gene in rack1a mutant background. The length of primary roots was measured from seedlings grown for 10 d under 14/10 h photoperiod. (D) The number of lateral roots in transgenic plants overexpressing individual RACK1 gene in rack1a mutant background. The number of lateral roots was counted from seedlings grown for 11 d under 14/10 h photoperiod. Shown in (C) and (D) are the averages of at least 20 seedlings ± S.E. *, significant difference from Col, P < 0.05.
Figure 6
Figure 6
The expression of RACK1A, RACK1B and RACK1C genes. (A) RT-PCR analysis of the expression of RACK1 genes in various tissues and organs of young seedlings and mature plants. RT-PCR was performed at 30 cycles. The expression of ACTIN2 was used as a control. (B) Quantitative real-time PCR analysis of the transcript levels of RACK1 genes. The transcript level of each RACK1 gene was normalized against the transcript level of ACTIN2 in each sample. The relative transcript levels of RACK1 genes were compared to that of RACK1C in the roots of 4 d-old, light-grown seedlings (set as 1). Shown are the averages of three replicates ± S.D.
Figure 7
Figure 7
The expression of RACK1 genes in rack1a, rack1b and rack1c single and double mutants. (A) RT-PCR analysis of the expression of RACK1 genes in rack1a, rack1b and rack1c single and double mutants. RT-PCR was performed at 28 cycles. The expression of ACTIN2 was used as a control. (B) Quantitative real-time PCR analysis of the transcript level of RACK1 genes in rack1a, rack1b and rack1c single and double mutants. The transcript level of RACK1 genes was normalized against the transcript level of ACTIN2 in each sample. The relative transcript level of RACK1 genes in mutant backgrounds was compared with that in wild-type (Col) (set as 1). Shown are the averages of three replicates ± S.D.
Figure 8
Figure 8
The model of unequal genetic redundancy of RACK1 genes in regulating plant development. Arabidopsis genome contains three RACK1 homologous genes, designated as RACK1A, RACK1B and RACK1C, respectively, which encode three highly similar proteins. RACK1 genes regulate plant development likely in a continuous quantitative manner. RACK1A is likely the ancestral gene whereas RACK1B and RACK1C are the duplicate genes, because RACK1A retains the most functions of RACK1 genes. The expression of RACK1 follows a general trend of RACK1A > RACK1B > RACK1C. A certain threshold of gene activity is likely required for the RACK1 genes to have any influence on plant development, and the gene activity can be saturated once an excess of gene activity is reached. Because the loss-of-function mutations in RACK1B or RACK1C or both do not confer any defects in plant development while enhancing the developmental defects of rack1a mutants, the residual activities of RACK1B and RACK1C are likely above this threshold but below the point of saturation. RACK1 genes mutually regulate each other's transcription. Both the difference in gene expression and the cross-regulation are likely the molecular determinants of unequal genetic redundancy of RACK1 genes in regulating plant development. The model is schematically based on the possible explanations for unequal genetic redundancy provided by Briggs et al. (2006) [16].

Similar articles

Cited by

References

    1. Mochly-Rosen D, Khaner H, Lopez J. Identification of intracellular receptor proteins for activated protein kinase C. Proc Natl Acad Sci USA. 1991;88:3997–4000. doi: 10.1073/pnas.88.9.3997. - DOI - PMC - PubMed
    1. Ron D, Chen CH, Caldwell J, Jamieson L, Orr E, Mochly-Rosen D. Cloning of an intracellular receptor for protein kinase C – A homolog of the β-subunit of G-proteins. Proc Natl Acad of Sci USA. 1994;91:839–843. doi: 10.1073/pnas.91.3.839. - DOI - PMC - PubMed
    1. McCahill A, Warwicker J, Bolger GB, Houslay MD, Yarwood SJ. The RACK1 scaffold protein: A dynamic cog in cell response mechanisms. Mol Pharmacol. 2002;62:1261–1273. doi: 10.1124/mol.62.6.1261. - DOI - PubMed
    1. Sklan EH, Podoly E, Soreq H. RACK1 has the nerve to act: structure meets function in the nervous system. Prog Neurobiol. 2006;78:117–134. doi: 10.1016/j.pneurobio.2005.12.002. - DOI - PubMed
    1. Ishida S, Takahashi Y, Nagata T. Isolation of cDNA of an auxin-regulated gene encoding a G-protein β-subunit-like protein from tobacco BY-2-cells. Proc Natl Acad Sci USA. 1993;90:11152–11156. doi: 10.1073/pnas.90.23.11152. - DOI - PMC - PubMed

Publication types

MeSH terms