Comparative Study
. 2009 Mar;150(3):1330-40.
doi: 10.1210/en.2008-0936. Epub 2008 Oct 23.

Strain-specific effects of rosiglitazone on bone mass, body composition, and serum insulin-like growth factor-I

Affiliations
Comparative Study

Strain-specific effects of rosiglitazone on bone mass, body composition, and serum insulin-like growth factor-I

Cheryl L Ackert-Bicknell et al. Endocrinology. 2009 Mar.

Abstract

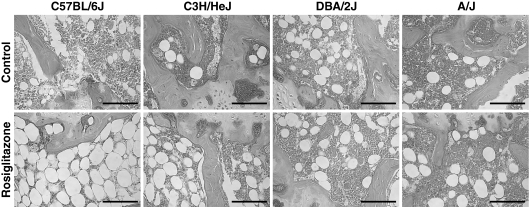
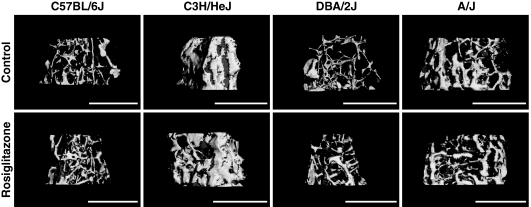
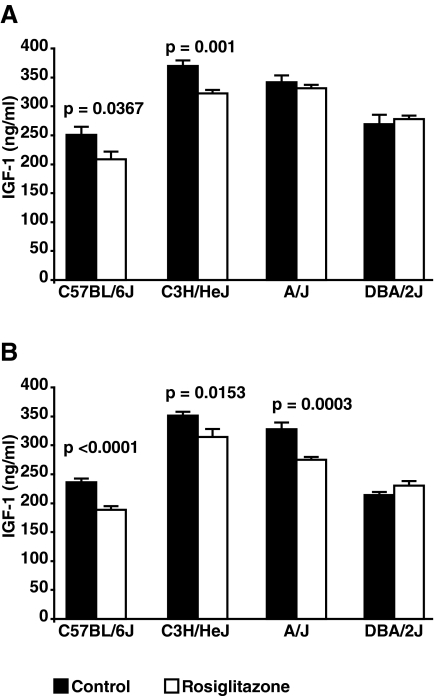
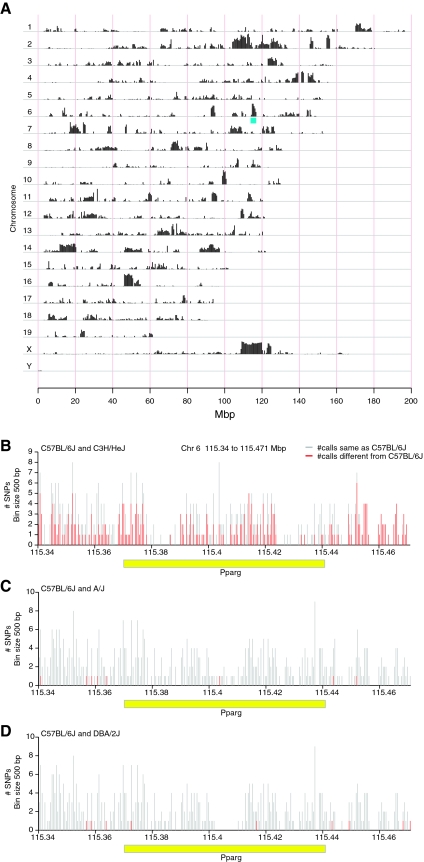
Activation of peroxisome proliferator activated receptor-gamma (PPARG) is required for the differentiation of marrow mesenchymal stem cell into adipocytes and is associated with the development of age-related marrow adiposity in mice. Thiazolidinediones are agonists for PPARG and have a heterogeneous effect on bone mineral density (BMD). We postulated that genetic determinants influence the skeletal response to thiazolidinediones. We examined the effects of rosiglitazone (3 mg/kg . d for 8 wk) on BMD, body composition, and serum IGF-I in adult female mice from four inbred strains. C3H/HeJ mice showed the most significant response to treatment, exhibiting decreased femoral and vertebral BMD, reduced distal femoral bone volume fraction and a decrease in serum IGF-I. In DBA/2J, there were no changes in femoral BMD or bone volume fraction, but there was a decrease in vertebral BMD. C57BL/6J mice showed increases in marrow adiposity, without associated changes in trabecular bone volume; the skeletal effects from rosiglitazone in A/J mice were minimal. No association between trabecular bone volume and marrow adiposity was found. The effect of rosiglitazone on gene expression in the femur was then examined in the C3H/HeJ and C57BL/6J strains by microarray. Increased gene expression was observed in the PPARG signaling pathway and fatty acid metabolism in both C3H/HeJ and C57BL/6J, but a significant down-regulation of genes associated with cell cycle was noted only in the C3H/HeJ strain. The divergent skeletal responses to rosiglitazone in this study suggest the existence of a strong genetic background effect.


Figures

Figure 1
Figure 1
μCT images of the distal femur. Digital reconstructions of the trabecular architecture of the distal femur are presented from the four inbred strains examined. Images from the control-treated mice are present in the top row and images from the rosiglitazone-treated mice are present in the bottom row. It is interesting to note that all strains except B6 exhibited an increase in TV. Only the C3H strain showed a significant change in the trabecular BV and the BV/TV%.
Figure 2
Figure 2
Static histology of the distal femoral marrow cavity. All images display in the center of the marrow cavity immediately proximal to the growth plate. Samples were decalcified, embedded in paraffin, sectioned, and then stained with hematoxylin and eosin. Images from the control-treated mice are present in the top row and images from the rosiglitazone-treated mice are present in the bottom row. As can be seen, there is little difference in the number of marrow adipocytes when comparing the control-treated samples. Rosiglitazone treatment resulted in a substantial increase in marrow adiposity in the B6 mice and slight increase in the C3H mice. Interestingly, in B6-treated mice, red marrow has been nearly replaced by adipocytes, but BV/TV% was not affected by rosiglitazone treatment. No changes were observed in the DBA or A/J mice.
Figure 3
Figure 3
Serum IGF-I. Serum IGF-I was assessed at baseline, after 1 wk of treatment, and at the conclusion of the experiment. A, The serum IGF-I levels in the B6 and C3H mice treated with rosiglitazone were significantly lower after 1 wk of treatment, compared with the controls. There was no difference found in the DBA and A/J strains. B, A similar difference in serum IGF-I was noted at the conclusion of the experiment for B6 and C3H. Unlike at 1 wk of treatment, serum IGF-I levels were decreased in the A/J strain after 8 wk of rosiglitazone treatment.
Figure 4
Figure 4
Serum osteocalcin. Serum osteocalcin was measured in all mice at the conclusion of treatment. After 8 wk of treatment, note differences in serum osteocalcin were found for either the B6 or C3H strain. A significant decrease was noted in the A/J strain and a significant increase was noted for the DBA/2J strain.
Figure 5
Figure 5
SNP differences between the inbred strains. A, SNP differences across the entire genome are plotted comparing the C3H/HeJ strain vs. the other three strains used in this study: B6, A/J, and DBA/2J. Each chromosome (Chr) is plotted on a separate line. Vertical black bars indicate the number of SNPs in that are different between these two strains per 0.5 Mbp window. The genomic location of Pparg on Chr 6 is noted in blue. B, The region between 115.34 and 115.471 Mbp on Chr 6 (contains the Pparg gene) showing the proportion of SNPs having allelic differences when comparing the C3H/HeJ and B6 strains. C, The same region as shown in A displaying allelic differences when comparing B6 with A/J. D, The same region as was shown in A displaying allelic differences when comparing B6 with DBA/2J. The x-axis denotes the genomic location in Mbps and the y-axes the number of SNPs per 500 bp bin. Vertical red bars indicate the number SNPs that are polymorphic between the two strains within a given 500-bp bin, and vertical gray bars indicate the total number of SNPs for which allele data are available for both strains in a given bin. The horizontal yellow bar denotes the Pparg gene.

References

    1. Spiegelman BM 1998 PPAR-γ: adipogenic regulator and thiazolidinedione receptor. Diabetes 47:507–514 - PubMed
    1. Krentz A, Bailey C 2005 Oral antidiabetic agents: current role in type 2 diabetes mellitus. Drugs 65:385–411 - PubMed
    1. Gerstein H, Yusuf S, Bosch J, Pogue J, Sheridan J, Dinccag N, Hanefeld M, Hoogwerf B, Laakso M, Mohan V, Shaw J, Zinman B, Holman R 2006 Effect of rosiglitazone on the frequency of diabetes in patients with impaired glucose tolerance or impaired fasting glucose: a randomised controlled trial. Lancet 368:1096–1105 - PubMed
    1. Knouff C, Auwerx J 2004 Peroxisome proliferator-activated receptor-γ calls for activation in moderation: lessons from genetics and pharmacology. Endocr Rev 25:899–918 - PubMed
    1. Rosen E, Sarraf P, Troy AE, Bradwin G, Moore K, Milstone DS, Speigelman BM, Mortensen RM 1999 PPAR γ is required for the differentiation of adipose tissue in vivo and in vitro. Mol Cell 4:611–617 - PubMed

Publication types

MeSH terms