

The inactivation principle: mathematical solutions minimizing the absolute work and biological implications for the planning of arm movements
- PMID: 18949023
- PMCID: PMC2561290
- DOI: 10.1371/journal.pcbi.1000194
The inactivation principle: mathematical solutions minimizing the absolute work and biological implications for the planning of arm movements
Abstract
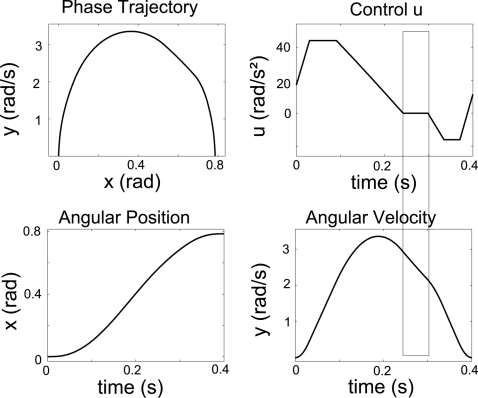
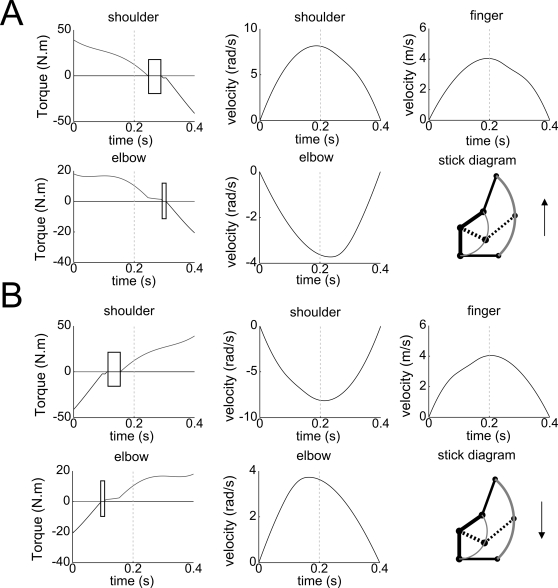
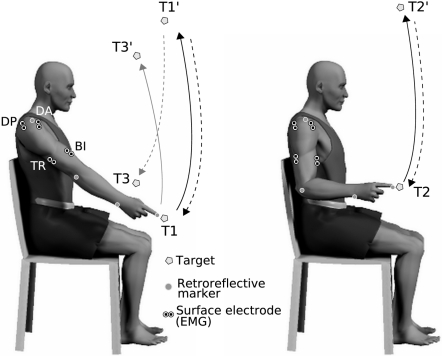
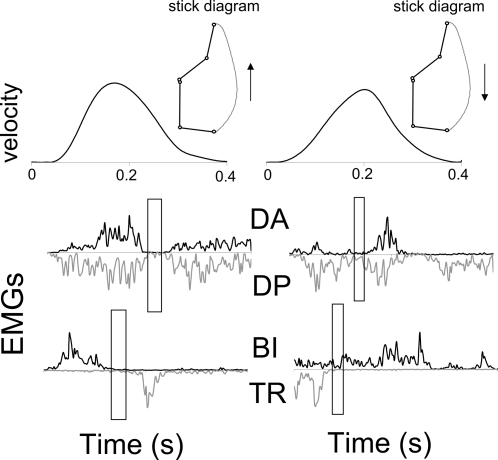
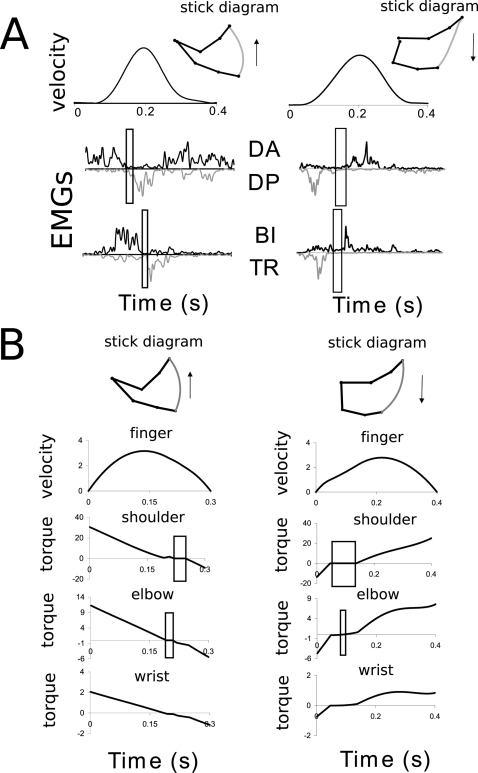
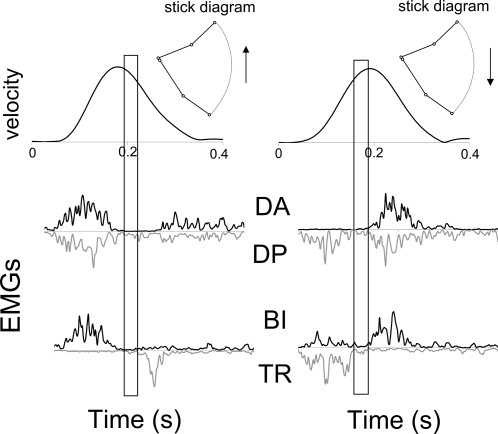
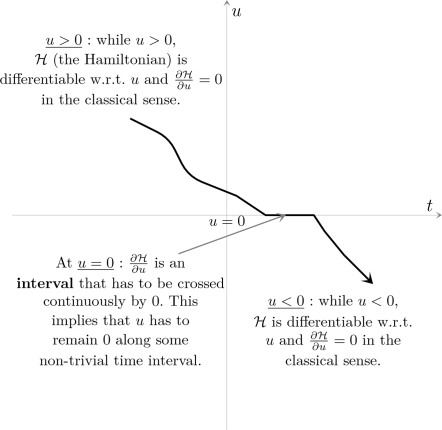
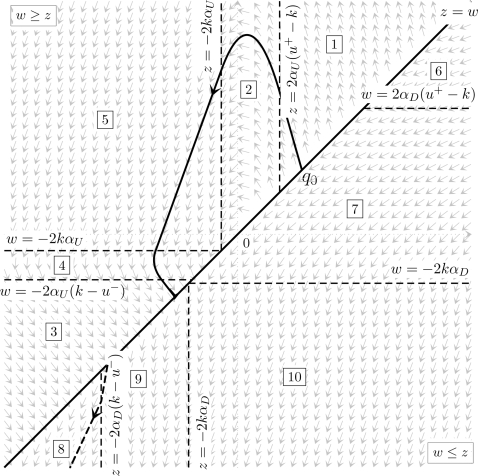
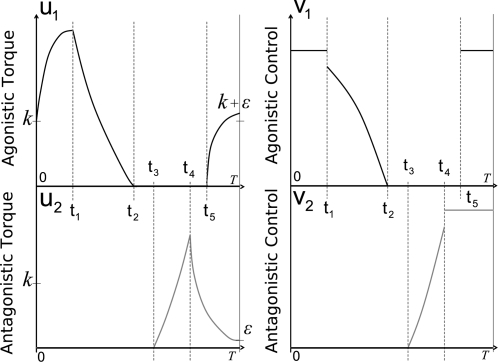
An important question in the literature focusing on motor control is to determine which laws drive biological limb movements. This question has prompted numerous investigations analyzing arm movements in both humans and monkeys. Many theories assume that among all possible movements the one actually performed satisfies an optimality criterion. In the framework of optimal control theory, a first approach is to choose a cost function and test whether the proposed model fits with experimental data. A second approach (generally considered as the more difficult) is to infer the cost function from behavioral data. The cost proposed here includes a term called the absolute work of forces, reflecting the mechanical energy expenditure. Contrary to most investigations studying optimality principles of arm movements, this model has the particularity of using a cost function that is not smooth. First, a mathematical theory related to both direct and inverse optimal control approaches is presented. The first theoretical result is the Inactivation Principle, according to which minimizing a term similar to the absolute work implies simultaneous inactivation of agonistic and antagonistic muscles acting on a single joint, near the time of peak velocity. The second theoretical result is that, conversely, the presence of non-smoothness in the cost function is a necessary condition for the existence of such inactivation. Second, during an experimental study, participants were asked to perform fast vertical arm movements with one, two, and three degrees of freedom. Observed trajectories, velocity profiles, and final postures were accurately simulated by the model. In accordance, electromyographic signals showed brief simultaneous inactivation of opposing muscles during movements. Thus, assuming that human movements are optimal with respect to a certain integral cost, the minimization of an absolute-work-like cost is supported by experimental observations. Such types of optimality criteria may be applied to a large range of biological movements.
Conflict of interest statement
The authors have declared that no competing interests exist.
Figures

Similar articles
-
Anticipatory control of center of mass and joint stability during voluntary arm movement from a standing posture: interplay between active and passive control.Exp Brain Res. 2002 Apr;143(3):318-27. doi: 10.1007/s00221-001-0968-6. Epub 2002 Feb 16. Exp Brain Res. 2002. PMID: 11889509
-
Analysis of an optimal control model of multi-joint arm movements.Biol Cybern. 1997 Feb;76(2):107-17. doi: 10.1007/s004220050325. Biol Cybern. 1997. PMID: 9116076
-
Vertical torque allows recording of anticipatory postural adjustments associated with slow, arm-raising movements.Clin Biomech (Bristol). 2005 Aug;20(7):693-9. doi: 10.1016/j.clinbiomech.2005.03.005. Clin Biomech (Bristol). 2005. PMID: 15921833 Clinical Trial.
-
Strategy of arm movement control is determined by minimization of neural effort for joint coordination.Exp Brain Res. 2016 Jun;234(6):1335-50. doi: 10.1007/s00221-016-4610-z. Epub 2016 Mar 16. Exp Brain Res. 2016. PMID: 26983620 Review.
-
Review of models for the generation of multi-joint movements in 3-D.Adv Exp Med Biol. 2009;629:523-50. doi: 10.1007/978-0-387-77064-2_28. Adv Exp Med Biol. 2009. PMID: 19227519 Review.
Cited by
-
How the required precision influences the way we intercept a moving object.Exp Brain Res. 2013 Oct;230(2):207-18. doi: 10.1007/s00221-013-3645-7. Epub 2013 Jul 16. Exp Brain Res. 2013. PMID: 23857171
-
Evidence for subjective values guiding posture and movement coordination in a free-endpoint whole-body reaching task.Sci Rep. 2016 Apr 7;6:23868. doi: 10.1038/srep23868. Sci Rep. 2016. PMID: 27053508 Free PMC article.
-
A cross-species neural integration of gravity for motor optimization.Sci Adv. 2021 Apr 7;7(15):eabf7800. doi: 10.1126/sciadv.abf7800. Print 2021 Apr. Sci Adv. 2021. PMID: 33827823 Free PMC article.
-
Optimal Biomechanical Performance in Upper-Limb Gestures Depends on Velocity and Carried Load.Biology (Basel). 2022 Mar 2;11(3):391. doi: 10.3390/biology11030391. Biology (Basel). 2022. PMID: 35336765 Free PMC article.
-
Shoulder pain and jerk during recovery phase of manual wheelchair propulsion.J Biomech. 2015 Nov 5;48(14):3937-44. doi: 10.1016/j.jbiomech.2015.09.018. Epub 2015 Oct 9. J Biomech. 2015. PMID: 26472307 Free PMC article.
References
-
- Bernstein N. The Coordination and Regulation of Movements. Oxford, UK: Pergamon Press; 1967.
-
- Morasso P. Spatial control of arm movements. Exp Brain Res. 1981;42:223–227. - PubMed
-
- Abend W, Bizzi E, Morasso P. Human arm trajectory formation. Brain. 1982;105:331–348. - PubMed
-
- Hollerbach MJ, Flash T. Dynamic interactions between limb segments during planar arm movement. Biol Cybern. 1982;44:67–77. - PubMed
Publication types
MeSH terms
LinkOut - more resources
Full Text Sources
