

Predicting unobserved phenotypes for complex traits from whole-genome SNP data
- PMID: 18949033
- PMCID: PMC2565502
- DOI: 10.1371/journal.pgen.1000231
Predicting unobserved phenotypes for complex traits from whole-genome SNP data
Abstract
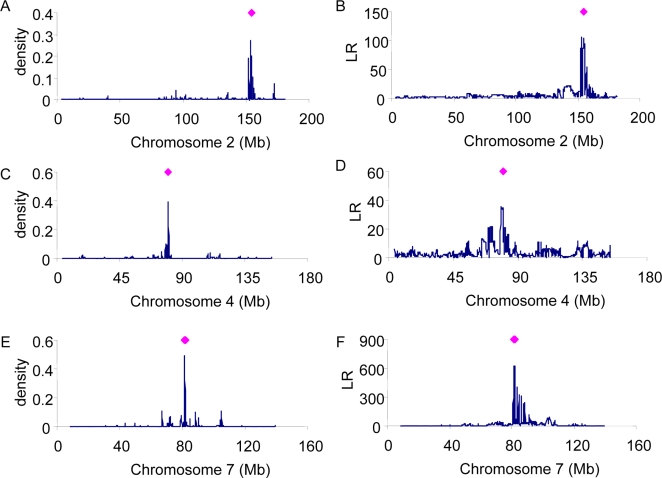
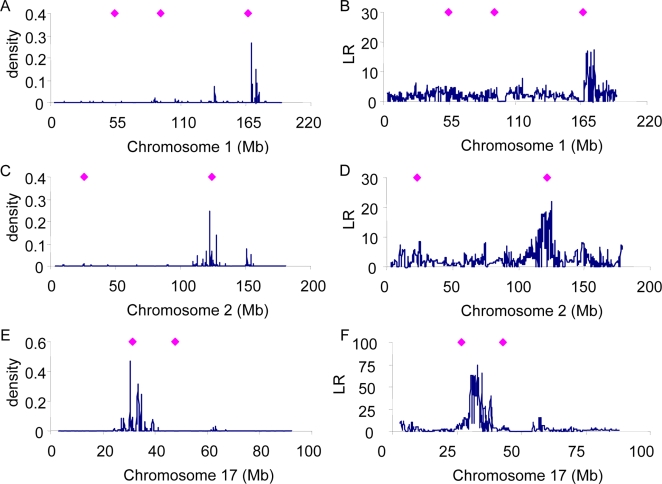
Genome-wide association studies (GWAS) for quantitative traits and disease in humans and other species have shown that there are many loci that contribute to the observed resemblance between relatives. GWAS to date have mostly focussed on discovery of genes or regulatory regions habouring causative polymorphisms, using single SNP analyses and setting stringent type-I error rates. Genome-wide marker data can also be used to predict genetic values and therefore predict phenotypes. Here, we propose a Bayesian method that utilises all marker data simultaneously to predict phenotypes. We apply the method to three traits: coat colour, %CD8 cells, and mean cell haemoglobin, measured in a heterogeneous stock mouse population. We find that a model that contains both additive and dominance effects, estimated from genome-wide marker data, is successful in predicting unobserved phenotypes and is significantly better than a prediction based upon the phenotypes of close relatives. Correlations between predicted and actual phenotypes were in the range of 0.4 to 0.9 when half of the number of families was used to estimate effects and the other half for prediction. Posterior probabilities of SNPs being associated with coat colour were high for regions that are known to contain loci for this trait. The prediction of phenotypes using large samples, high-density SNP data, and appropriate statistical methodology is feasible and can be applied in human medicine, forensics, or artificial selection programs.
Conflict of interest statement
The authors have declared that no competing interests exist.
Figures


References
-
- Zanke BW, Greenwood CM, Rangrej J, Kustra R, Tenesa A, et al. Genome-wide association scan identifies a colorectal cancer susceptibility locus on chromosome 8q24. Nat Genet. 2007;39:989–994. - PubMed
-
- Yeager M, Orr N, Hayes RB, Jacobs KB, Kraft P, et al. Genome-wide association study of prostate cancer identifies a second risk locus at 8q24. Nat Genet. 2007;39:645–649. - PubMed
Publication types
MeSH terms
LinkOut - more resources
Full Text Sources
Other Literature Sources
Research Materials
