

On the functional significance of the P1 and N1 effects to illusory figures in the notch mode of presentation
- PMID: 18949043
- PMCID: PMC2567430
- DOI: 10.1371/journal.pone.0003505
On the functional significance of the P1 and N1 effects to illusory figures in the notch mode of presentation
Abstract
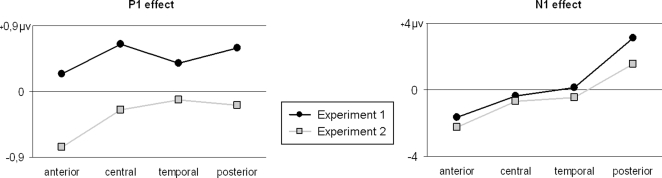
The processing of Kanizsa figures have classically been studied by flashing the full "pacmen" inducers at stimulus onset. A recent study, however, has shown that it is advantageous to present illusory figures in the "notch" mode of presentation, that is by leaving the round inducers on screen at all times and by removing the inward-oriented notches delineating the illusory figure at stimulus onset. Indeed, using the notch mode of presentation, novel P1 and N1 effects have been found when comparing visual potentials (VEPs) evoked by an illusory figure and the VEPs to a control figure whose onset corresponds to the removal of outward-oriented notches, which prevents their integration into one delineated form. In Experiment 1, we replicated these findings, the illusory figure was found to evoke a larger P1 and a smaller N1 than its control. In Experiment 2, real grey squares were placed over the notches so that one condition, that with inward-oriented notches, shows a large central grey square and the other condition, that with outward-oriented notches, shows four unconnected smaller grey squares. In response to these "real" figures, no P1 effect was found but a N1 effect comparable to the one obtained with illusory figures was observed. Taken together, these results suggest that the P1 effect observed with illusory figures is likely specific to the processing of the illusory features of the figures. Conversely, the fact that the N1 effect was also obtained with real figures indicates that this effect may be due to more global processes related to depth segmentation or surface/object perception.
Conflict of interest statement
Figures


Similar articles
-
Alternative mode of presentation of Kanizsa figures sheds new light on the chronometry of the mechanisms underlying the perception of illusory figures.Neuropsychologia. 2008 Jan 31;46(2):554-66. doi: 10.1016/j.neuropsychologia.2007.10.001. Epub 2007 Oct 10. Neuropsychologia. 2008. PMID: 18022651
-
Electrophysiological Modulation in an Effort to Complete Illusory Figures: Configuration, Illusory Contour and Closure Effects.Brain Topogr. 2018 Mar;31(2):202-217. doi: 10.1007/s10548-017-0582-y. Epub 2017 Aug 14. Brain Topogr. 2018. PMID: 28808817
-
Effect of connectivity and bistability on the visual potentials evoked by illusory figures.Neuroreport. 2006 Feb 6;17(2):157-61. doi: 10.1097/01.wnr.0000198432.21765.6e. Neuroreport. 2006. PMID: 16407763
-
Neural dynamics of form perception: boundary completion, illusory figures, and neon color spreading.Psychol Rev. 1985 Apr;92(2):173-211. Psychol Rev. 1985. PMID: 3887450 Review. No abstract available.
-
Functional neuroimaging findings on the human perception of illusory contours.Neurosci Biobehav Rev. 2006;30(5):595-612. doi: 10.1016/j.neubiorev.2005.11.002. Epub 2006 Feb 2. Neurosci Biobehav Rev. 2006. PMID: 16457887 Review.
References
-
- Petry S, Meyer GE. The perception of illusory contours. New York/Berlin: Springer-Verlag; 1987. p. 320.
-
- Brodeur M, Lepore F, Lepage M, Bacon BA, Jemel B, et al. Alternative mode of presentation of Kanizsa figures sheds new light on the chronometry of the mechanisms underlying the perception of illusory figures. Neuropsychologia. 2008;46:554–566. - PubMed
Publication types
MeSH terms
LinkOut - more resources
Full Text Sources
