

Concentration-detection functions for the odor of homologous n-acetate esters
- PMID: 18950650
- PMCID: PMC2639399
- DOI: 10.1016/j.physbeh.2008.09.021
Concentration-detection functions for the odor of homologous n-acetate esters
Abstract
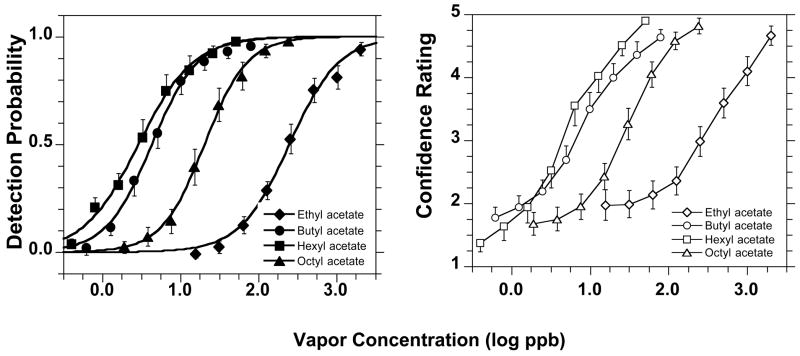
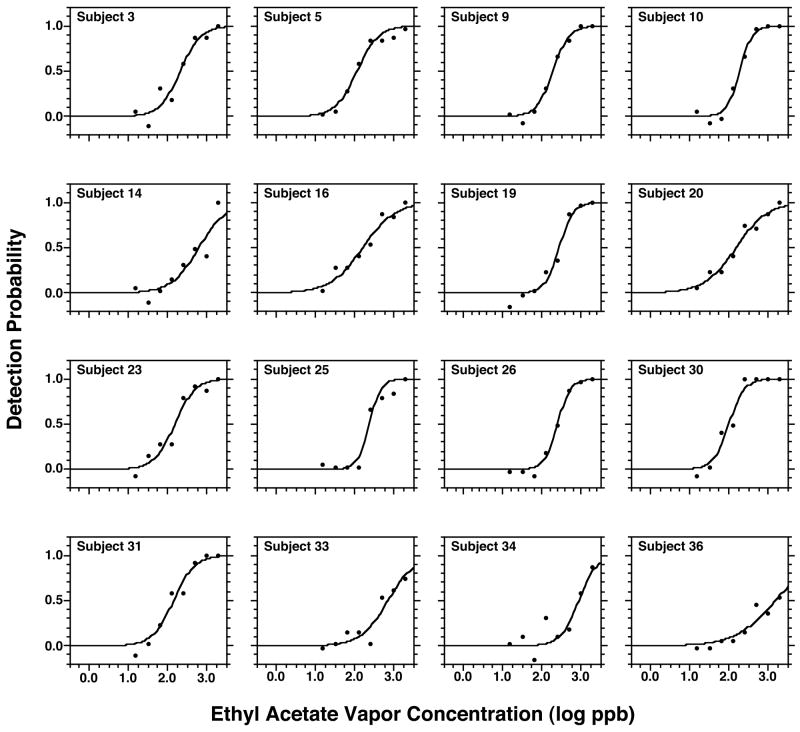
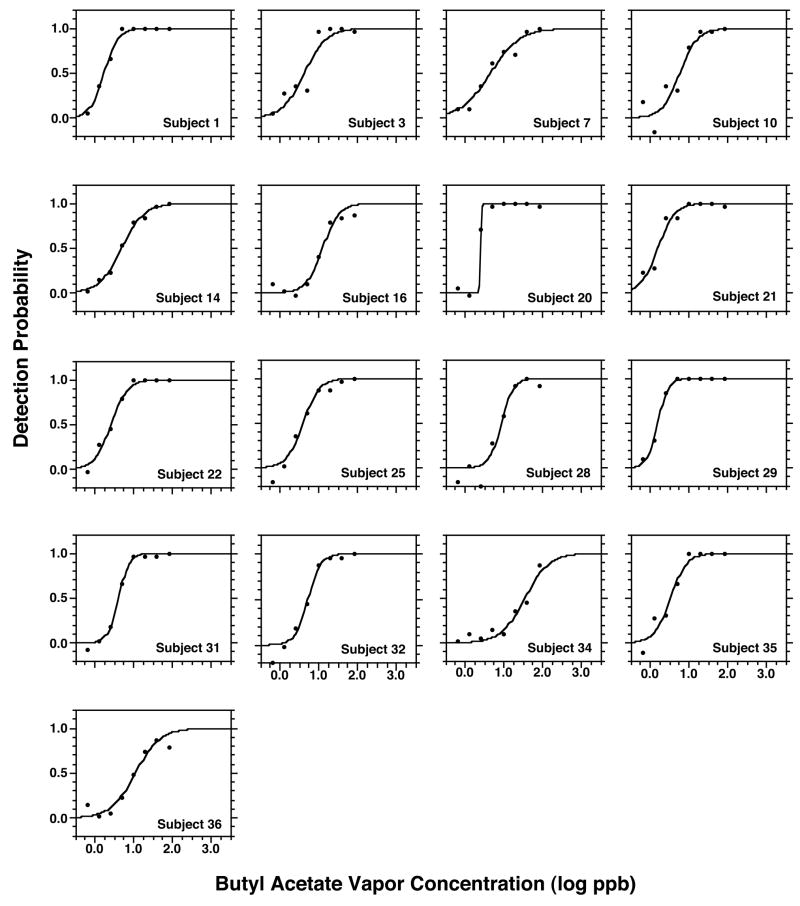
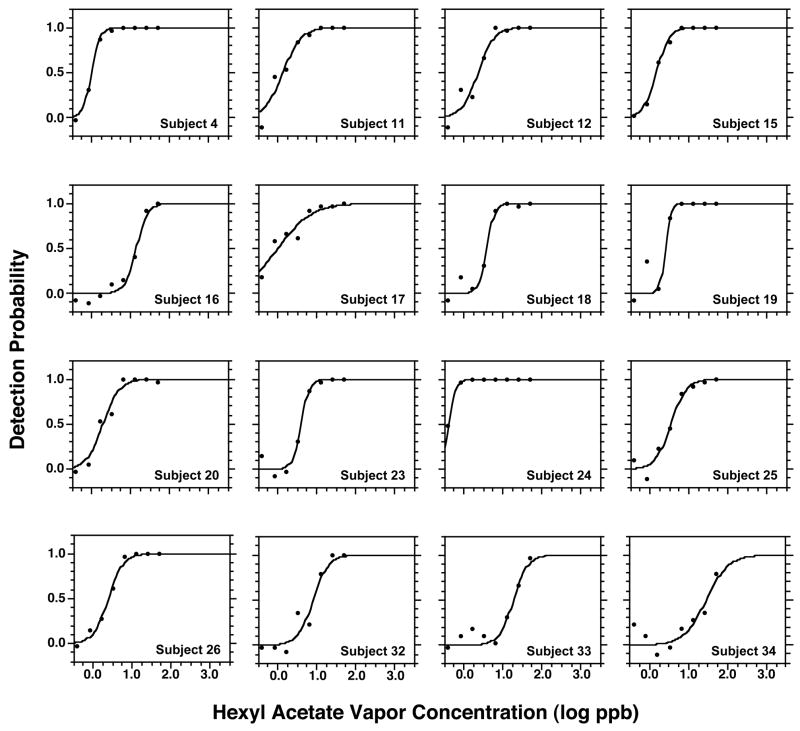
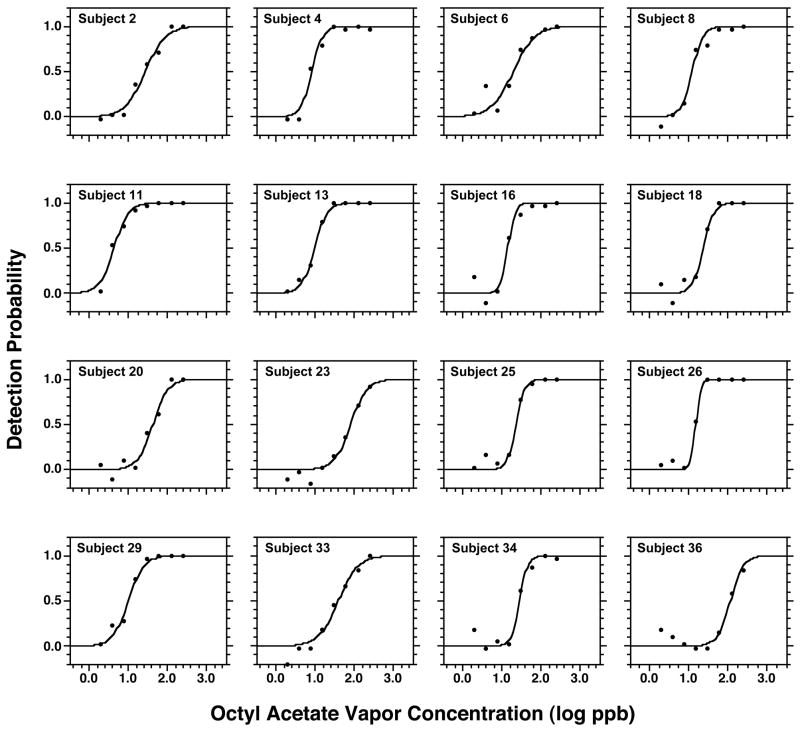
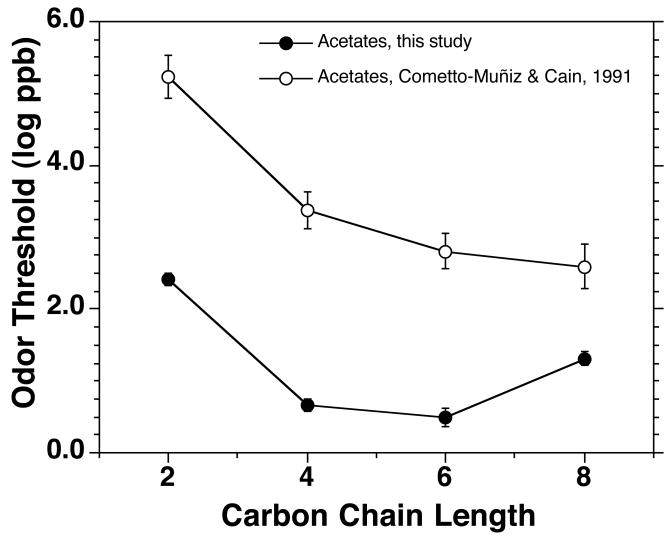
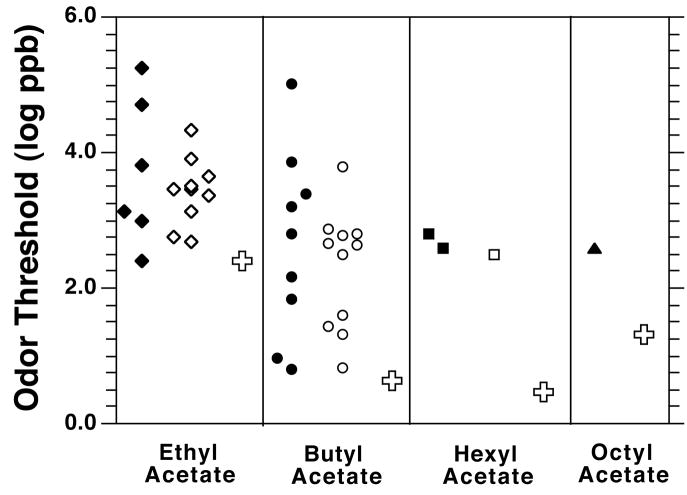
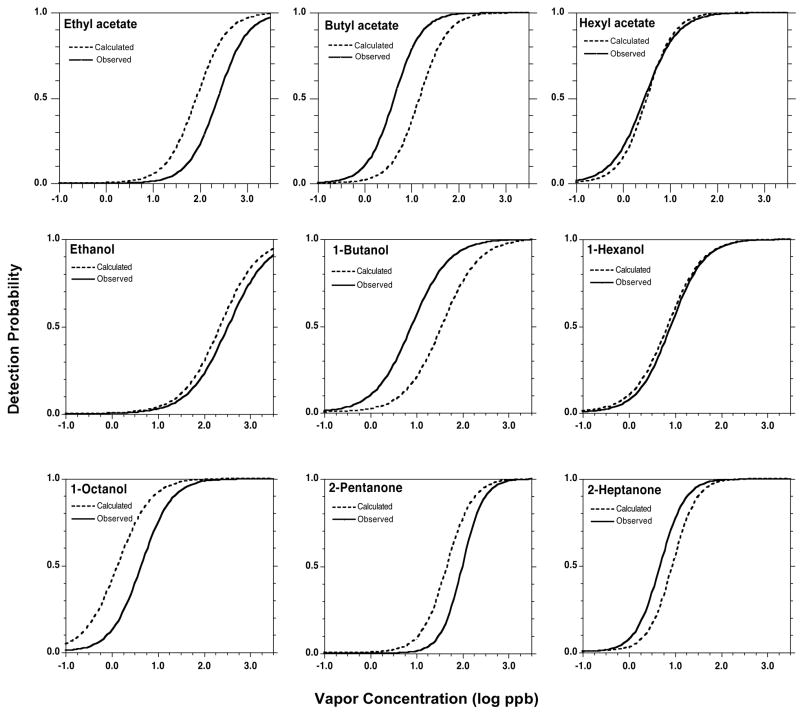
Using air-dilution olfactometry, we measured concentration-response functions for the odor detection of the homologous esters ethyl, butyl, hexyl, and octyl acetate. Stimuli were delivered by means of an 8-station vapor delivery device (VDD-8) specifically designed to capture odor detection performance by humans under environmentally realistic conditions. Groups of 16-17 (half female) normosmic (i.e., having a normal olfaction) non-smokers (ages 18-38) were tested intensively. The method involved a three-alternative forced-choice procedure against carbon-filtered air, with an ascending concentration approach. Delivered concentrations were confirmed by gas chromatography before and during actual testing. A sigmoid (logistic) model provided an excellent fit to the odor detection functions both at the group and individual levels. Odor detection thresholds (ODTs) (defined as the half-way point between chance and perfect detection) decreased from ethyl (245 ppb by volume), to butyl (4.3 ppb), to hexyl acetate (2.9 ppb), and increased for octyl acetate (20 ppb). Interindividual threshold variability was near one and always below two orders of magnitude. The steepness of the functions increased slightly but significantly with carbon chain length. The outcome showed that the present thresholds lie at the very low end of those previously reported, but share with them a similar relative trend across n-acetates. On this basis, we suggest that a recent quantitative structure-activity relationship (QSAR) for ODTs can be applied to these and additional optimized data, and used to describe and predict not just ODTs but the complete underlying psychometric odor functions.
Figures
Similar articles
-
Structure-activity relationships on the odor detectability of homologous carboxylic acids by humans.Exp Brain Res. 2010 Nov;207(1-2):75-84. doi: 10.1007/s00221-010-2430-0. Epub 2010 Oct 8. Exp Brain Res. 2010. PMID: 20931179 Free PMC article.
-
Odor detection by humans of lineal aliphatic aldehydes and helional as gauged by dose-response functions.Chem Senses. 2010 May;35(4):289-99. doi: 10.1093/chemse/bjq018. Epub 2010 Feb 26. Chem Senses. 2010. PMID: 20190010 Free PMC article.
-
Olfactory detectability of homologous n-alkylbenzenes as reflected by concentration-detection functions in humans.Neuroscience. 2009 Jun 16;161(1):236-48. doi: 10.1016/j.neuroscience.2009.03.029. Epub 2009 Mar 20. Neuroscience. 2009. PMID: 19303922 Free PMC article.
-
Dose-Response Functions for the Olfactory, Nasal Trigeminal, and Ocular Trigeminal Detectability of Airborne Chemicals by Humans.Chem Senses. 2016 Jan;41(1):3-14. doi: 10.1093/chemse/bjv060. Epub 2015 Oct 17. Chem Senses. 2016. PMID: 26476441 Review.
-
The perception of odor is not a surrogate marker for chemical exposure: a review of factors influencing human odor perception.Clin Toxicol (Phila). 2013 Feb;51(2):70-6. doi: 10.3109/15563650.2013.767908. Clin Toxicol (Phila). 2013. PMID: 23387344 Review.
Cited by
-
PLS regression-based chemometric modeling of odorant properties of diverse chemical constituents of black tea and coffee.RSC Adv. 2018 Jan 9;8(5):2293-2304. doi: 10.1039/c7ra12914a. eCollection 2018 Jan 9. RSC Adv. 2018. PMID: 35558685 Free PMC article.
-
Structure-activity relationships on the odor detectability of homologous carboxylic acids by humans.Exp Brain Res. 2010 Nov;207(1-2):75-84. doi: 10.1007/s00221-010-2430-0. Epub 2010 Oct 8. Exp Brain Res. 2010. PMID: 20931179 Free PMC article.
-
Determination of odor detection threshold in the Gottingen minipig.Chem Senses. 2010 Oct;35(8):727-34. doi: 10.1093/chemse/bjq076. Epub 2010 Aug 6. Chem Senses. 2010. PMID: 20693277 Free PMC article.
-
Olfactory Impact of Terpene Alcohol on Terpenes Aroma Expression in Chrysanthemum Essential Oils.Molecules. 2018 Oct 29;23(11):2803. doi: 10.3390/molecules23112803. Molecules. 2018. PMID: 30380636 Free PMC article.
-
Hydrogen bonding between solutes in solvents octan-1-ol and water.J Org Chem. 2010 Nov 19;75(22):7651-8. doi: 10.1021/jo1014646. Epub 2010 Oct 18. J Org Chem. 2010. PMID: 20954704 Free PMC article.
References
-
- Buck L, Axel R. A novel multigene family may encode odorant receptors: a molecular basis for odor recognition. Cell. 1991;65:175–187. - PubMed
-
- Hatt H. Molecular and cellular basis of human olfaction. Chem Biodivers. 2004;1:1857–1869. - PubMed
-
- Malnic B, Hirono J, Sato T, Buck LB. Combinatorial receptor codes for odors. Cell. 1999;96:713–723. - PubMed
-
- Zou Z, Buck LB. Combinatorial effects of odorant mixes in olfactory cortex. Science. 2006;311:1477–1481. - PubMed
