. 2008 Nov;29(11):1342-54.
doi: 10.1002/humu.20896.

Classification of rare missense substitutions, using risk surfaces, with genetic- and molecular-epidemiology applications

Affiliations

Classification of rare missense substitutions, using risk surfaces, with genetic- and molecular-epidemiology applications

Sean V Tavtigian et al. Hum Mutat. 2008 Nov.

Abstract

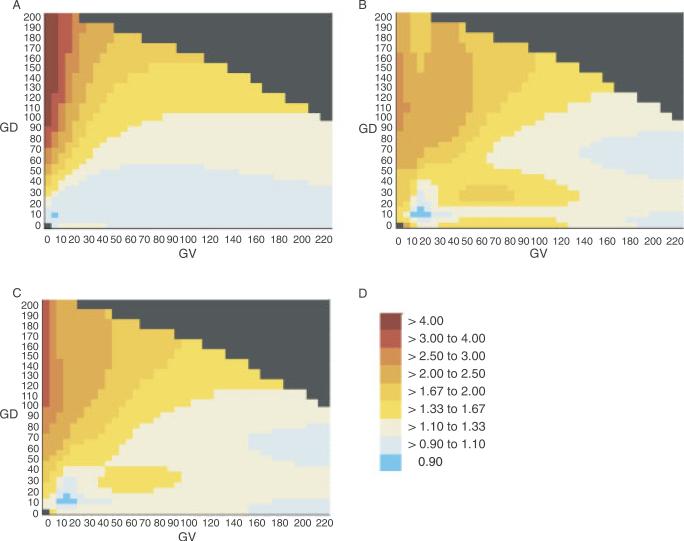
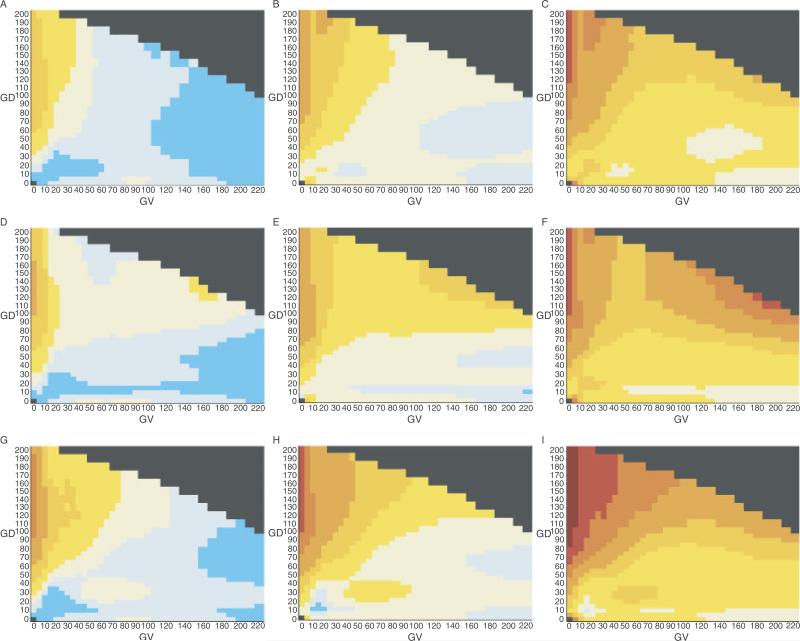
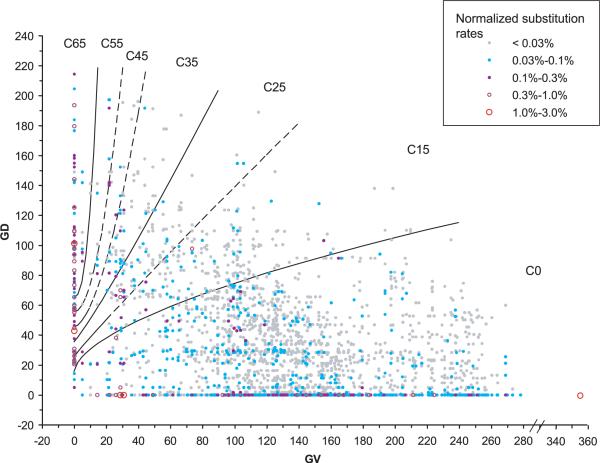
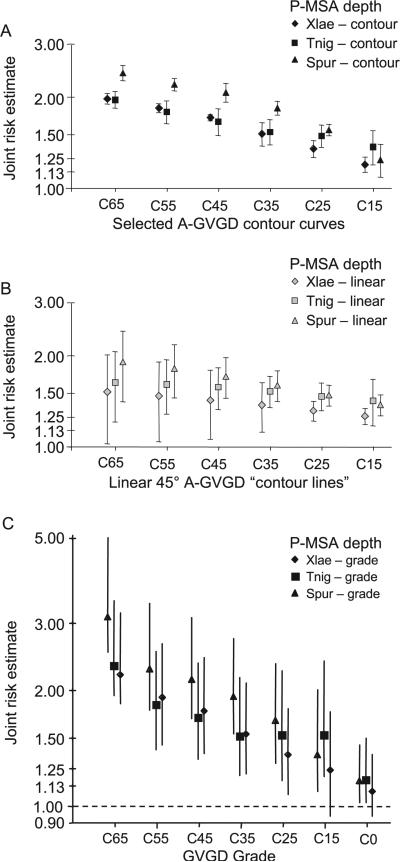
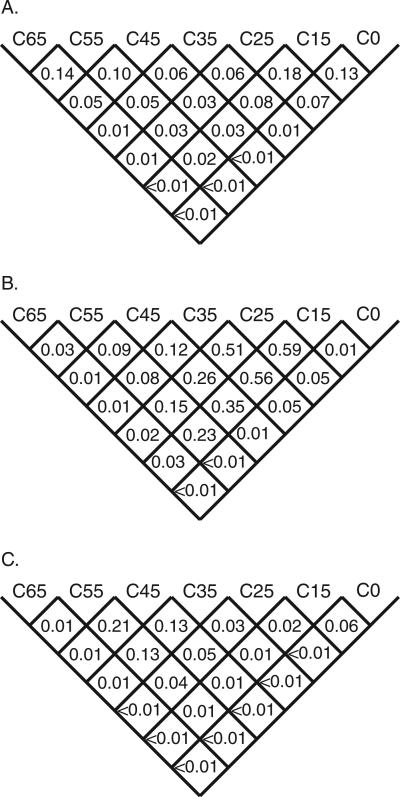
Many individually rare missense substitutions are encountered during deep resequencing of candidate susceptibility genes and clinical mutation screening of known susceptibility genes. BRCA1 and BRCA2 are among the most resequenced of all genes, and clinical mutation screening of these genes provides an extensive data set for analysis of rare missense substitutions. Align-GVGD is a mathematically simple missense substitution analysis algorithm, based on the Grantham difference, which has already contributed to classification of missense substitutions in BRCA1, BRCA2, and CHEK2. However, the distribution of genetic risk as a function of Align-GVGD's output variables Grantham variation (GV) and Grantham deviation (GD) has not been well characterized. Here, we used data from the Myriad Genetic Laboratories database of nearly 70,000 full-sequence tests plus two risk estimates, one approximating the odds ratio and the other reflecting strength of selection, to display the distribution of risk in the GV-GD plane as a series of surfaces. We abstracted contours from the surfaces and used the contours to define a sequence of missense substitution grades ordered from greatest risk to least risk. The grades were validated internally using a third, personal and family history-based, measure of risk. The Align-GVGD grades defined here are applicable to both the genetic epidemiology problem of classifying rare missense substitutions observed in known susceptibility genes and the molecular epidemiology problem of analyzing rare missense substitutions observed during case-control mutation screening studies of candidate susceptibility genes.


Figures

FIGURE 1
FIGURE 1
AR and ERS heat maps. A: AR heat map using the sequence alignment through sea urchin. B: ERS heat map using the sequence alignment through sea urchin. C: Joint risk estimate heat map using the sequence alignment through sea urchin. D: Risk estimate color lookup table. Note: This table is used for all of the heat maps in Figures 1 and 2.
FIGURE 2
FIGURE 2
Joint risk estimate heat maps and confidence intervals. Row 1: Heat maps based on the sequence alignment through frog; Row 2: heat maps based on the sequence alignment through puffer fish; Row 3: heat maps based on the sequence alignment through sea urchin; Column 1: 5th centile heat maps; Column 2: actual data heat maps; Column 3: 95th centile heat maps.
FIGURE 3
FIGURE 3
Align-GVGD contour curves displayed with distributions of substitution probability. Each point or circle on the graph represents a coordinate in the GV-GD plane that is occupied by one or more of the possible missense substitutions that can result from a single-nucleotide substitution in the BRCA1 RING domain, BRCT domain, or BRCA2 DNA binding domain. Beyond values of GV and GD, each possible single-nucleotide substitution is associated with an underlying dinucleotide substitution rate constant [Lunter and Hein, 2004]. The color and size of the point or circle represent the rate constant. If two or more possible substitutions have exactly the same GV and GD coordinates, then their underlying dinucleotide substitution rate constants are added together to get the total rate constant for that coordinate.The color/size intensities of the substitution rate constant representations are normalized so that the total for the figure is 100%. Visual integration of the color/size intensities for substitution within a grade gives the proportion of all possible missense substitutions that are grouped in that grade.This particular graph displays the missense distribution obtained from the sequence alignment through sea urchin. The equations of the contour curves are: GD = 65+tan(10°) × (GV2.5); GD = 55+tan(10°) × (GV2.0); GD = 45+tan(15°) × (GV1.7); GD = 35+tan(50°) × (GV1.1); GD = 25+tan(55°) × (GV0.95); GD = 15+tan(75°) × (GV0.6).
FIGURE 4
FIGURE 4
Contour curve and grade risk estimates. A: Joint risk estimates averaged from 20 points spaced evenly along each selected contour curve at each of the three depths of alignment. Closed error bars give ±1 standard deviation from the joint risk estimate at the GD0 intercept. B: Joint risk estimates averaged from 20 evenly points spaced evenly along each linear 45° reference “contour line.” Closed error bars give ±1 standard deviation from the joint risk estimate at the GD0 intercept. C: Joint risk estimates averaged from 50 evenly spaced points within each grade. Open error bars give the 95th percentile confidence intervals, determined from 1,000 bootstrap samplings over the underlying data.
FIGURE 5
FIGURE 5
Grade cross-comparisons.The value given in each cell is the probability, from bootstrap sampling, that the average joint risk estimate for missense substitutions falling into the lower numbered grade of the pair-wise comparison is greater than the average joint risk estimate for missense substitutions falling into the higher numbered grade. A: Using the alignment through frog. B: Using the alignment through puffer fish. C: Using the alignment through sea urchin.

References

    1. Abkevich V, Zharkikh A, Deffenbaugh A, Frank D, Chen Y, Shattuck D, Skolnick MH, Gutin A, Tavtigian SV. Analysis of missense variation in human BRCA1 in the context of interspecific sequence variation. J Med Gen. 2004;41:492–507. - PMC - PubMed
    1. Capriotti E, Arbiza L, Casadio R, Dopazo J, Dopazo H, Marti-Renom MA. Use of estimated evolutionary strength at the codon level improves the prediction of disease-related protein mutations in humans. Hum Mutat. 2008;29:198–204. - PubMed
    1. Chan PA, Duraisamy S, Miller PJ, Newell JA, McBride C, Bond JP, Raevaara T, Ollila S, Nystrom M, Grimm AJ, Christodoulou J, Oetting WS, Greenblatt MS. Interpreting missense variants: comparing computational methods in human disease genes CDKN2A, MLH1, MSH2, MECP2, and tyrosinase (TYR). Hum Mutat. 2007;28:683–693. - PubMed
    1. Chenevix-Trench G, Healey S, Lakhani S, Waring P, Cummings M, Brinkworth R, Deffenbaugh AM, Burbidge LA, Pruss D, Judkins T, Scholl T, Bekessy A, Marsh A, Lovelock P, Wong M, Tesoriero A, Renard H, Southey M, Hopper JL, Yannoukakos K, Brown M, Easton D, Tavtigian SV, Goldgar D, Spurdle AB. Genetic and histopathologic evaluation of BRCA1 and BRCA2 DNA sequence variants of unknown clinical significance. Cancer Res. 2006;66:2019–2027. - PubMed
    1. Cohen JC, Kiss RS, Pertsemlidis A, Marcel YL, McPherson R, Hobbs HH. Multiple rare alleles contribute to low plasma levels of HDL cholesterol. Science. 2004;305:869–872. - PubMed

Publication types