. 2009 Apr;87(5):1207-18.
doi: 10.1002/jnr.21918.

Activation and reversal of lipotoxicity in PC12 and rat cortical cells following exposure to palmitic acid

Affiliations

Activation and reversal of lipotoxicity in PC12 and rat cortical cells following exposure to palmitic acid

Frankis G Almaguel et al. J Neurosci Res. 2009 Apr.

Abstract

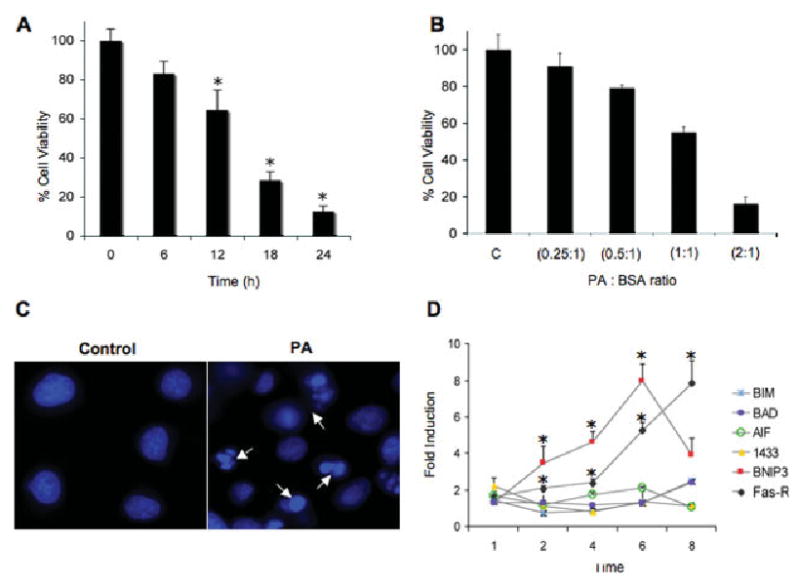
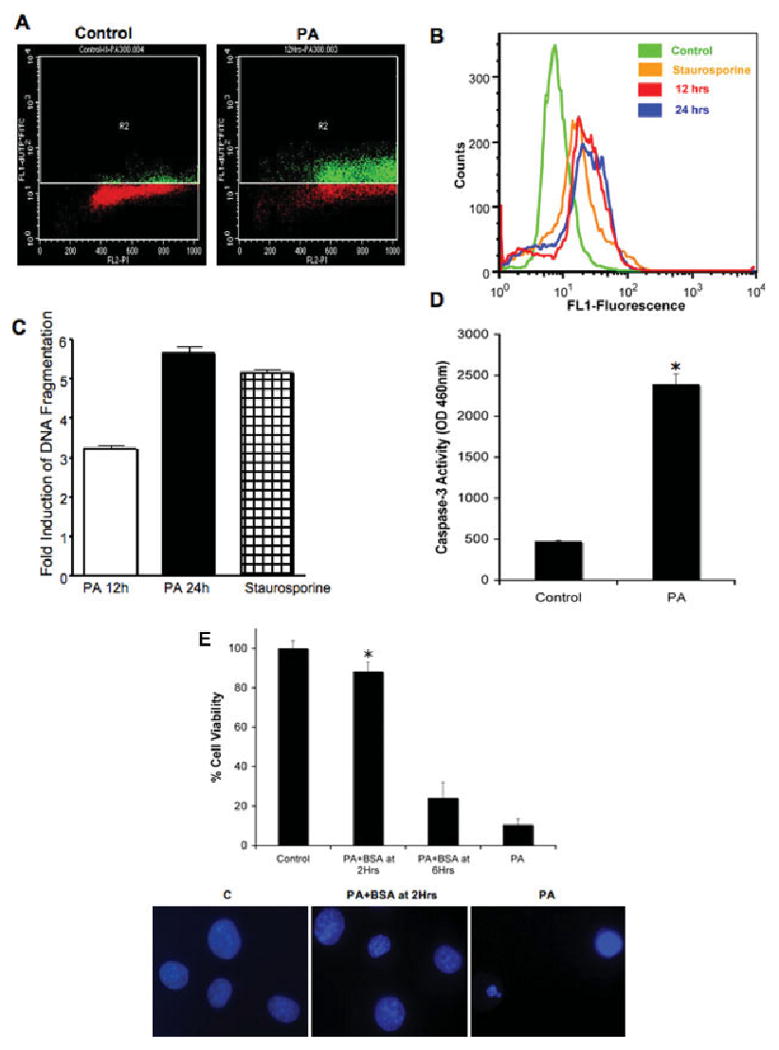
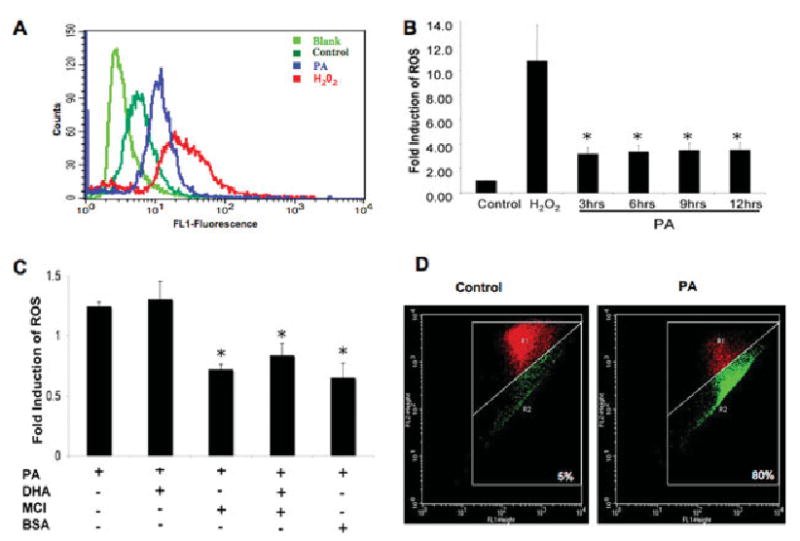
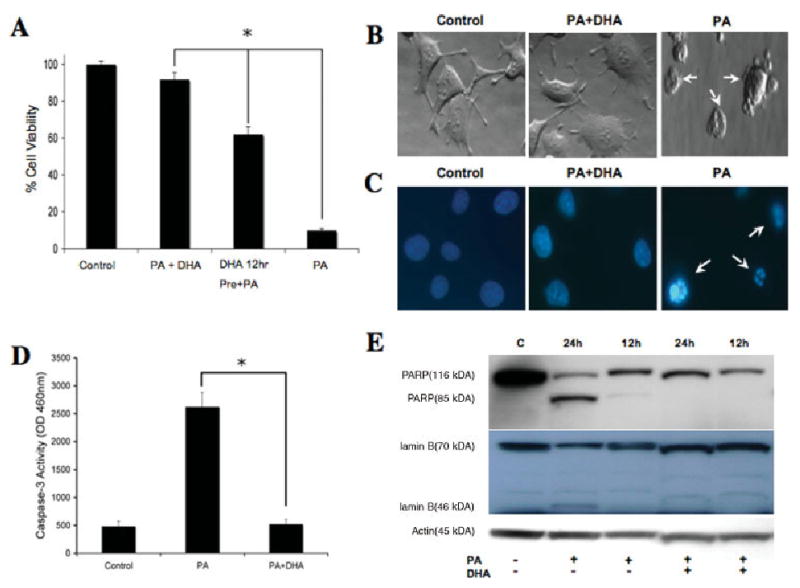
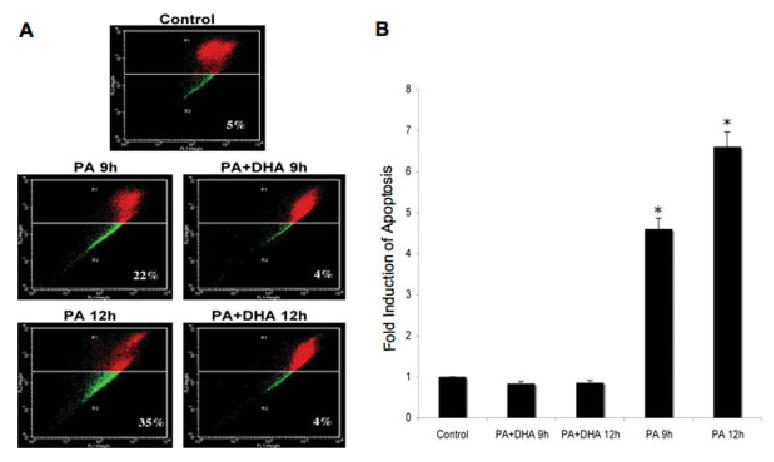
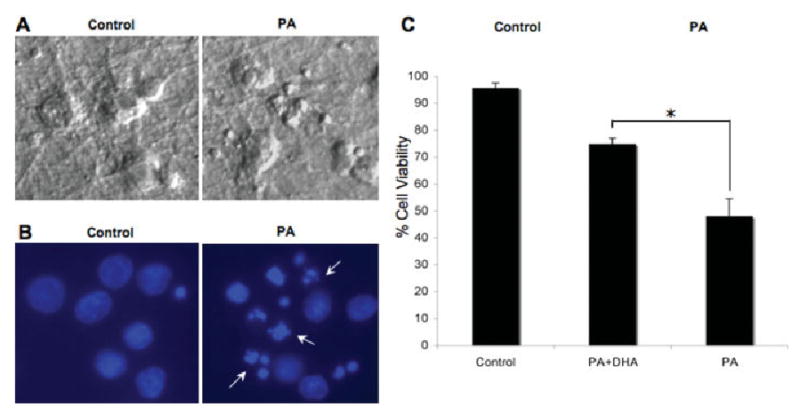
Lipotoxicity involves a series of pathological cellular responses after exposure to elevated levels of fatty acids. This process may be detrimental to normal cellular homeostasis and cell viability. The present study shows that nerve growth factor-differentiated PC12 cells (NGFDPC12) and rat cortical cells (RCC) exposed to high levels of palmitic acid (PA) exhibit significant lipotoxicity and death linked to an "augmented state of cellular oxidative stress" (ASCOS). The ASCOS response includes generation of reactive oxygen species (ROS), alterations in the mitochondrial transmembrane potential, and increase in the mRNA levels of key cell death/survival regulatory genes. The observed cell death was apoptotic based on nuclear morphology, caspase-3 activation, and cleavage of lamin B and PARP. Quantitative real-time PCR measurements showed that cells undergoing lipotoxicity exhibited an increase in the expression of the mRNAs encoding the cell death-associated proteins BNIP3 and FAS receptor. Cotreatment of NGFDPC12 and RCC cells undergoing lipotoxicity with docosahexaenoic acid (DHA) and bovine serum albumin (BSA) significantly reduced cell death within the first 2 hr following the initial exposure to PA. The data suggest that lipotoxicity in NGFDPC12 and cortical neurons triggers a strong cell death apoptotic response. Results with NGFDPC12 cells suggest a linkage between induction of ASCOS and the apoptotic process and exhibit a temporal window that is sensitive to DHA and BSA interventions.


Figures

Fig. 1
Fig. 1
Palmitic acid-induced lipotoxicity in NGFDPC12 cells. A: NGFDPC12 cells were exposed to PA/BSA (2:1 ratio), and viability was determined using WST-1 assay at the indicated times. B: NGFDPC12 cells were exposed to different PA/BSA ratios (0.25:1, 0.5:1, 1:1, and 2:1 with BSA at a concentration of 0.150 mM) for 24 hr. Cell viability was measured by the WST-1 assay. C: NGFDPC12 cells were exposed to 0.150 mM BSA without PA (control) or PA/BSA (2:1; PA) for 12 hr. Cells were stained with Hoechst (10 ng/liter), and nuclei were visualized under fluorescent microscopy. Arrows indicate nuclei showing chromatin condensation and fragmentation. D: Regulation of apoptosis-asociated genes in NGFDPC12 cultures exposed to PA/BSA (2:1). Quantitative RT-PCR experiments show the time-dependent mRNA expression of Bim, Bad, AIF, BNIP-3, 14.3.3, and FAS-R. GAPDH mRNA expression was used as the internal control. Data represent mean 6 SEM of three independent experiments. ★P < 0.05 compared with control.
Fig. 2
Fig. 2
DNA fragmentation and caspase-3 activity of NGFDPC12 cells exposed to PA. A: Representative experimental results of BRDU-FITC plots (apoptotic cells) vs. PI (total DNA marker) for controls and cells exposed to PA/BSA (2:1) for 12 hr. The R2 quadrant shows cells exhibiting increased BrdU-FITC fluorescence (green). Nonapoptotic cells are indicated in red. B: Representative distribution diagram of positive apoptotic NGFDPC12 cells. Cells were treated with BSA for negative control (green), PA/BSA (2:1) for 12 hr (red) or 24 hr (blue), or staurosporine for positive control (orange). C: Quantitative analysis of positive apoptotic NGFDPC12 cells as shown in B. The data represent the mean ± SEM of three independent experiments done in triplicate. D: Caspase-3 activity in cell extracts was determined in control or NGFDPC12 cells treated with PA/BSA for 12 hr. E: Early posttreatment with BSA protects NGFDPC12 cells from PA-induced lipotoxicity. Additional BSA (0.6 mM final concentration) was added to NGFDPC-12 cells at 2 or 6 hr after initial PA/BSA (2:1 ratio) treatment. Percentage of viable cells was measured by the WST-1 assay at the end of a 24-hr incubation period. Nuclei in bottom panel were visualized with Hoechst staining. Data represent mean ± SEM of three independent experiments. ★P < 0.05 compared with control.
Fig. 3
Fig. 3
ROS generation and changes in mitochondrial membrane permeability in NGFDPC12 cells undergoing PA-induced lipotoxicity. A: ROS generation in NGFDPC12 cells was detected by the 2′,7′ -dichlorofluorescein diacetate (DCF) method at 12 hr after the initial exposure to PA using flow cytometry. NGFDPC12 cells were treated with no DCF (light green), DCF (dark green), PA + DCF (blue), or hydrogen peroxide + DCF (red). B: Quantification of ROS production in NGFDPC12 cells at 3, 6, 9, and 12 hr after PA/BSA treatment. C: ROS modulation after addition of DHA, MCI-186, or BSA to NCGDPC12 cells treated with PA for 6 hr. D: Mitochondrial depolarization in NGFDPC12 cells, control or PA/BSA treated, detected by JC-1 flow cytometric analysis. JC-1 was detected in the FL1 or FL2 channel depending on its aggregation status (see Mqaterials and Methods). The R2 quadrant defines cells with leaky mitochondria showing reduced FL2 readings (green). Cells with intact mitochondria are indicated in R1 (red). Data represent mean ± SEM sent of at least three independent experiments. ★P < 0.05 compared with control.
Fig. 4
Fig. 4
Inhibition of fatty acid-induced lipotoxicity by DHA. A: DHA inhibits induction of cell death by PA in NGFDPC12 cells. Cell viability was determined after treatment for 24 hr as follows: 0.150 mM BSA alone (control), PA/BSA 2:1 ratio (PA), PA/BSA 2:1 cotreated with DHA followed by an increase in BSA final concentration to 0.6 mM at 6 hr (PA + DHA + BSA at 6 hr), and DHA pretreatment for 12 hr followed by treatment with PA/BSA 2:1 (DHA 12 hr pre + PA). B: DHA treatment inhibits apoptotic features of NGFDPC12 cells treated with PA/BSA. Morphology of NGFDPC12 cells treated with BSA alone (control), PA/BSA 2:1 cotreated with DHA, or PA/BSA 2:1 for 24 hr. C: Nuclear morphology of NGFDPC12 cells treated with BSA alone (control), PA/BSA 2:1 cotreated with DHA or PA/BSA 2:1 for 24 hr. Arrows indicate nuclei exhibiting fragmentation. D: DHA cotreatment produced a significant inhibitory effect of caspase-3 activity in cellular extracts of NGFDPC12 cells exposed to PA/BSA (2:1). E: Cleavage of PARP and lamin B in NGFDPC-12 cells exposed to PA/BSA (2:1), as assessed by Western blotting. PA treatment induced the appearance of the signature apoptotic fragments of PARP (85 kDa) or lamin B (46 kDa). DHA inhibited PARP and lamin B cleavage. Data in A and D represent mean ± SEM of three independent experiments. ★P < 0.05.
Fig. 5
Fig. 5
DHA reduces mitochondrial depolarization of NGFDPC12 cells undergoing PA-induced lipotoxicity. A: NGFDPC12 cells were treated with PA/BSA alone (PA) or in the presence DHA (PA + DHA) for 9 or 12 hr, and mitochondrial depolarization was determined by JC-1 flow cytometry assays. Representative flow cytometric plots are shown. B: Quantification of mitochondria depolarization (R2 in JC-1 flow cytometry) in NGFDPC12 cells undergoing PA-induced lipotoxicity. Data represent mean ± SEM of three independent experiments. ★P < 0.05.
Fig. 6
Fig. 6
PA-induced lipotoxicity and DHA neuroprotective action on primary rat cortical cells (RCC). A: Cellular morphology of control and treated (PA/BSA, 2:1, 48 hr) RCC. B: Nuclear morphology of control and treated RCC. Arrows indicate fragmented nuclei. C: Viability of RCC treated for 48 hr with PA/BSA (2:1 ratio; PA) or in cotreatment with DHA (PA + DHA). Viability was determined using the WST-1 assay. Data represent mean ± SEM of three independent experiments. ★P < 0.05.

References

    1. Abe K, Kogure K, Yamamoto H, Imazawa M, Miyamoto K. Mechanism of arachidonic acid liberation during ischemia in gerbil cerebral cortex. J Neurochem. 1987;48:503–509. - PubMed
    1. Aid S, Vancassel S, Poumes-Ballihaut C, Chalon S, Guesnet P, Lavialle M. Effect of a diet-induced n-3 PUFA depletion on cholinergic parameters in the rat hippocampus. J Lipid Res. 2003;44:1545–1551. - PubMed
    1. Arab K, Rossary A, Flourie F, Tourneur Y, Steghens JP. Docosahexaenoic acid enhances the antioxidant response of human fibroblasts by upregulating gamma-glutamyl-cysteinyl ligase and glutathione reductase. Br J Nutr. 2006;95:18–26. - PubMed
    1. Auestad N, Korsak RA, Morrow JW, Edmond J. Fatty acid oxidation and ketogenesis by astrocytes in primary culture. J Neurochem. 1991;56:1376–1386. - PubMed
    1. Bazan NG., Jr Effects of ischemia and electroconvulsive shock on free fatty acid pool in the brain. Biochim Biophys Acta. 1970;218:1–10. - PubMed

MeSH terms