. 2009 Feb 1;44(3):857-69.
doi: 10.1016/j.neuroimage.2008.09.029. Epub 2008 Oct 7.

Influence of heart rate on the BOLD signal: the cardiac response function

Affiliations

Influence of heart rate on the BOLD signal: the cardiac response function

Catie Chang et al. Neuroimage. .

Abstract

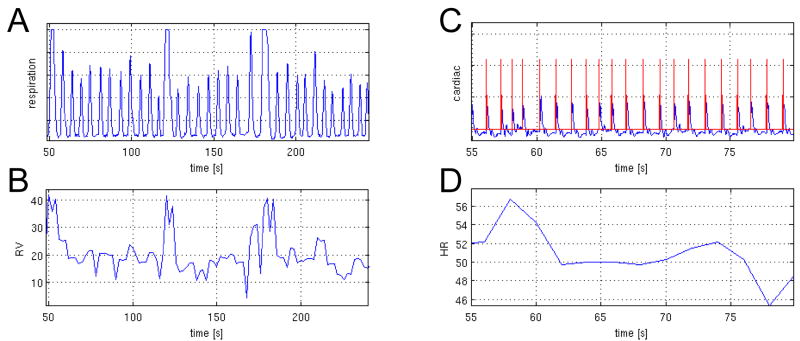
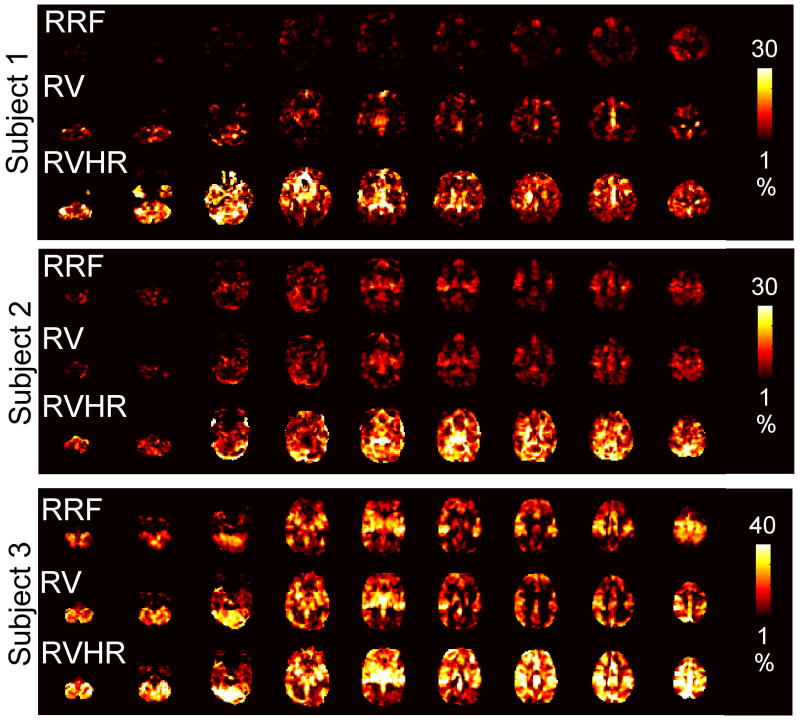
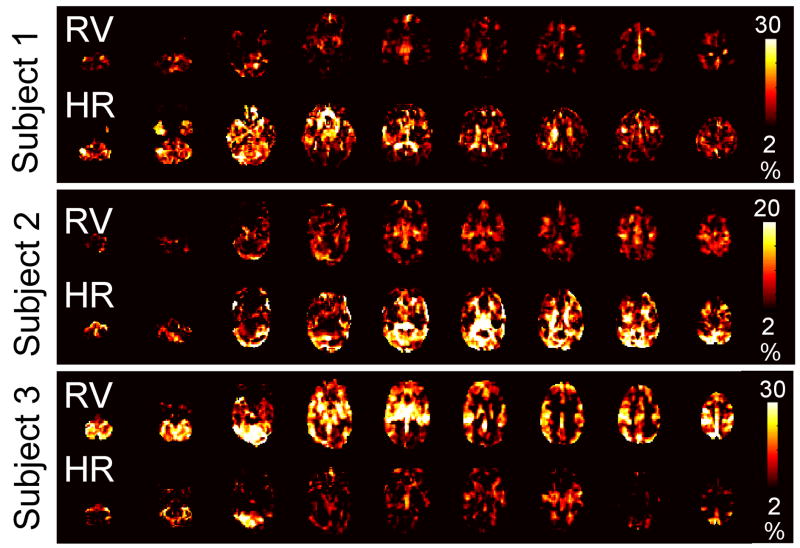
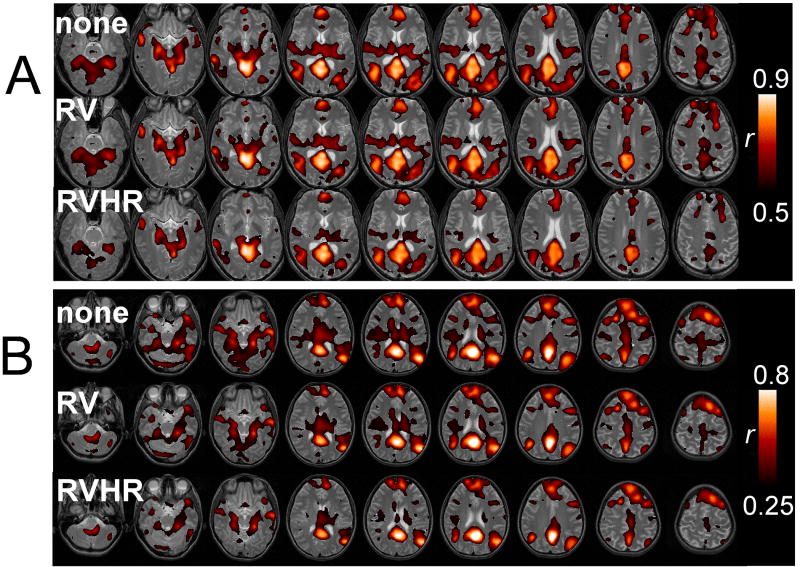
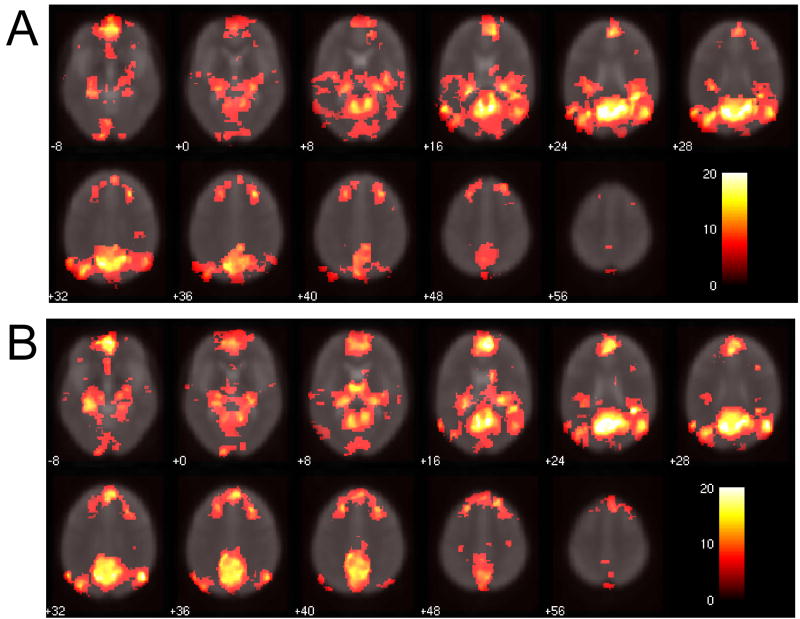
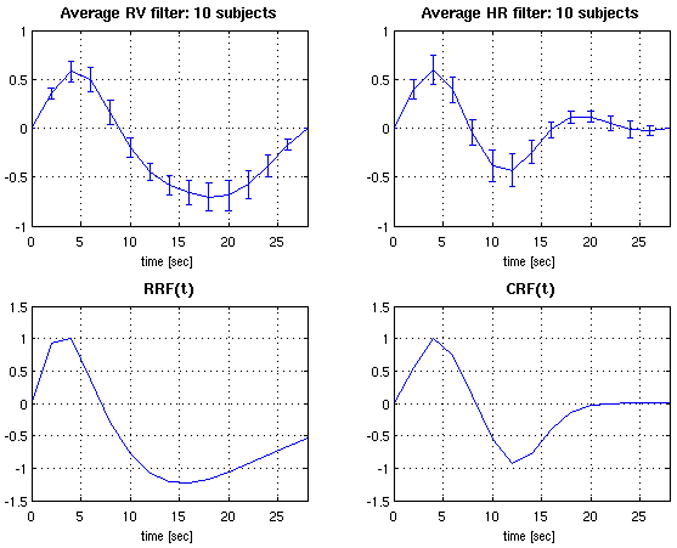
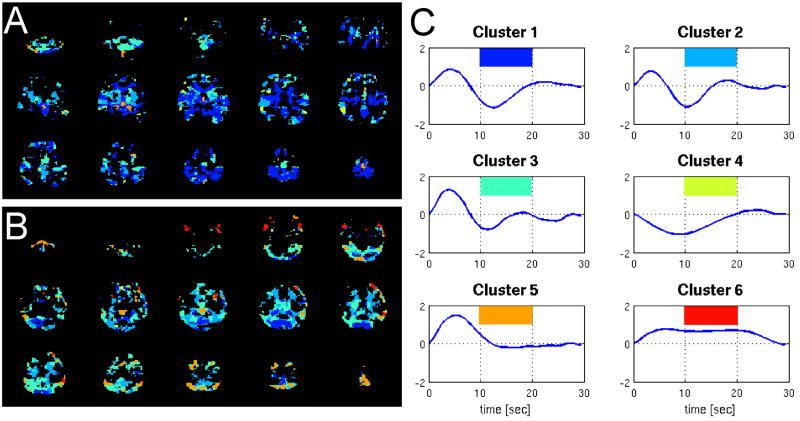
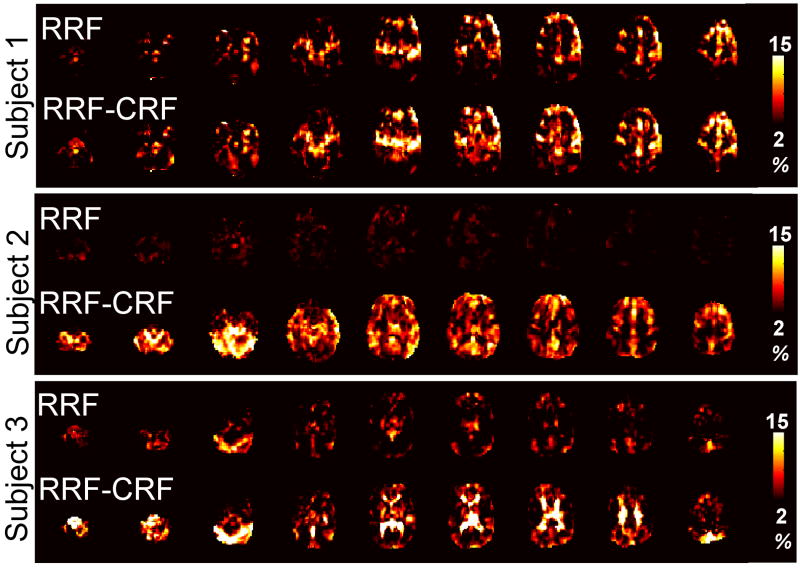
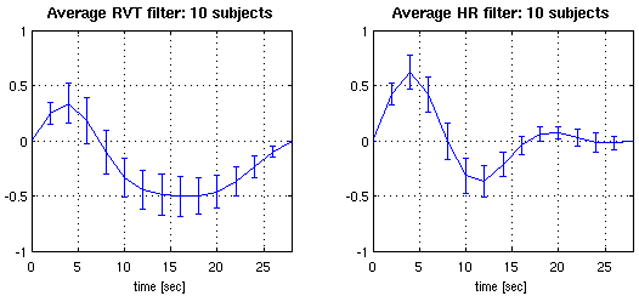
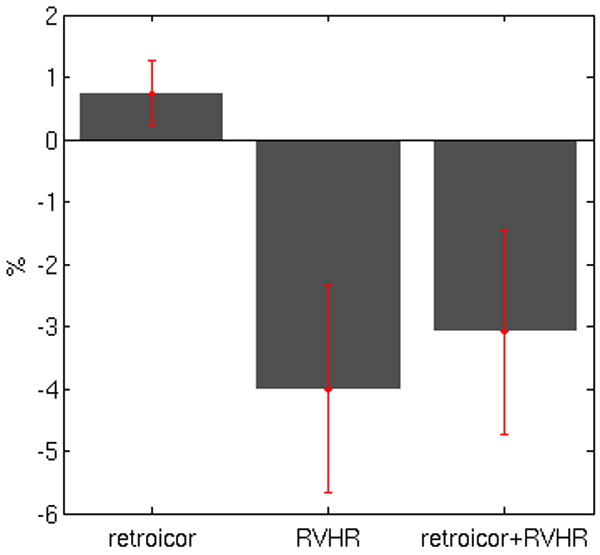
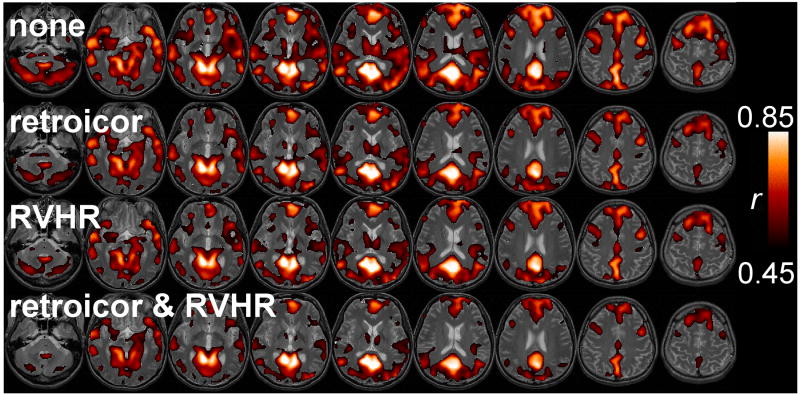
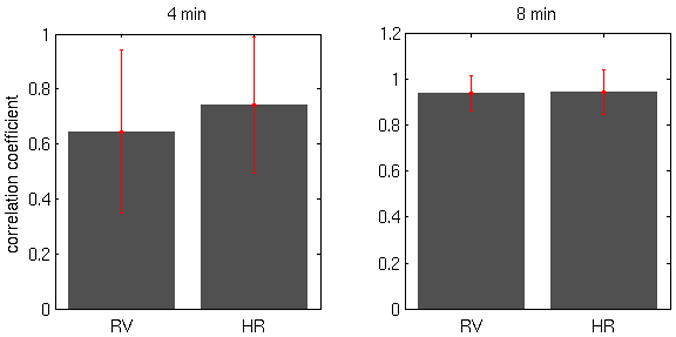
It has previously been shown that low-frequency fluctuations in both respiratory volume and cardiac rate can induce changes in the blood-oxygen level dependent (BOLD) signal. Such physiological noise can obscure the detection of neural activation using fMRI, and it is therefore important to model and remove the effects of this noise. While a hemodynamic response function relating respiratory variation (RV) and the BOLD signal has been described [Birn, R.M., Smith, M.A., Jones, T.B., Bandettini, P.A., 2008b. The respiration response function: The temporal dynamics of fMRI signal fluctuations related to changes in respiration. Neuroimage 40, 644-654.], no such mapping for heart rate (HR) has been proposed. In the current study, the effects of RV and HR are simultaneously deconvolved from resting state fMRI. It is demonstrated that a convolution model including RV and HR can explain significantly more variance in gray matter BOLD signal than a model that includes RV alone, and an average HR response function is proposed that well characterizes our subject population. It is observed that the voxel-wise morphology of the deconvolved RV responses is preserved when HR is included in the model, and that its form is adequately modeled by Birn et al.'s previously-described respiration response function. Furthermore, it is shown that modeling out RV and HR can significantly alter functional connectivity maps of the default-mode network.


Figures

Figure 1
Figure 1
Example of physiological time courses for 1 subject, showing (A) respiration belt measurements, (B) the calculated RV, (C) cardiac cycle with triggers, and (D) the calculated HR. Note that (A,B) are displayed on a different time scale than (C,D).
Figure 2
Figure 2
Maps of the percent signal variance explained in Rest2 by the RRF, RV, and RVHR models, shown for 3 subjects.
Figure 3
Figure 3
Maps of the percent signal variance explained in Rest2 by the RV (top line) and HR (bottom line) components of the RVHR model, for the same 3 subjects and slices shown in Figure 1.
Figure 4
Figure 4
Default-mode network for 2 subjects (A and B) without correction (top line), with correction using the RV model (middle line) and with correction using the RVHR model (bottom line).
Figure 5
Figure 5
Group-level DMN connectivity maps (A) without correction for physiological noise, and (B) with correction using RETROICOR and RVHR. Color bars depict T-values.
Figure 6
Figure 6
Deconvolved HR (A) and RV (B) filters from the RVHR model, averaged over 10 subjects. Error bars show the standard error. (C) RRF model from (Birn et al., 2008b). (D) Analytic function fitted to the average HR filter.
Figure 7
Figure 7
Clustering of HR filters across voxels. The mean HR filter for each cluster is shown on the right (C), in decreasing order of cluster size (1=largest, 6=smallest). Color-coded maps showing the locations of each cluster for 2 subjects (A,B) are on the left.
Figure 8
Figure 8
Maps of the percent signal variance explained by the RRF (top line) and RRF-CRF (bottom line) models, for 3 subjects from a separate dataset.
Figure 9
Figure 9
Deconvolved HR and RVT filters from the RVHR model, when RVT was used instead of RV. Curves depict the average (±SE) over 10 subjects.
Figure 10
Figure 10
Default-mode network changes due to correction with RETROICOR, RVHR, and both RETROICOR and RVHR. Bar height indicates the mean percent change in the extent of voxels having significant (p<0.05) DMN connectivity following the indicated corrections. The sign of each bar reveals the direction of change (negative = smaller connectivity extent; positive = larger connectivity extent).
Figure 11
Figure 11
Comparison of default-mode network maps with (A) no correction, (B) correction using RETROICOR, (C) correction using the RVHR model, (D) correction using both RETROICOR and RVHR.
Figure 12
Figure 12
Average correlation (±SD) between voxel-wise RV and HR filters from 4 min versus 12 min of data (left), and 8 min versus 12 min of data (right).

References

    1. Bandettini PA, Wong EC, Hinks RS, Tikofsky RS, Hyde JS. Time course EPI of human brain function during task activation. Magn Reson Med. 1992;25:390–397. - PubMed
    1. Binder JR, Frost JA, Hammeke TA, Bellgowan PS, Rao SM, Cox RW. Conceptual processing during the conscious resting state. A functional MRI study. J Cogn Neurosci. 1999;11:80–95. - PubMed
    1. Birn RM, Diamond JB, Smith MA, Bandettini PA. Separating respiratory-variation-related fluctuations from neuronal-activity-related fluctuations in fMRI. Neuroimage. 2006;31:1536–1548. - PubMed
    1. Birn RM, Murphy K, Bandettini PA. The effect of respiration variations on independent component analysis results of resting state functional connectivity. Hum Brain Mapp 2008a - PMC - PubMed
    1. Birn RM, Smith MA, Jones TB, Bandettini PA. The respiration response function: The temporal dynamics of fMRI signal fluctuations related to changes in respiration. Neuroimage. 2008b;40:644–654. - PMC - PubMed

Publication types