

Antiviral resistance and the control of pandemic influenza: the roles of stochasticity, evolution and model details
- PMID: 18952105
- PMCID: PMC2624577
- DOI: 10.1016/j.jtbi.2008.09.021
Antiviral resistance and the control of pandemic influenza: the roles of stochasticity, evolution and model details
Abstract
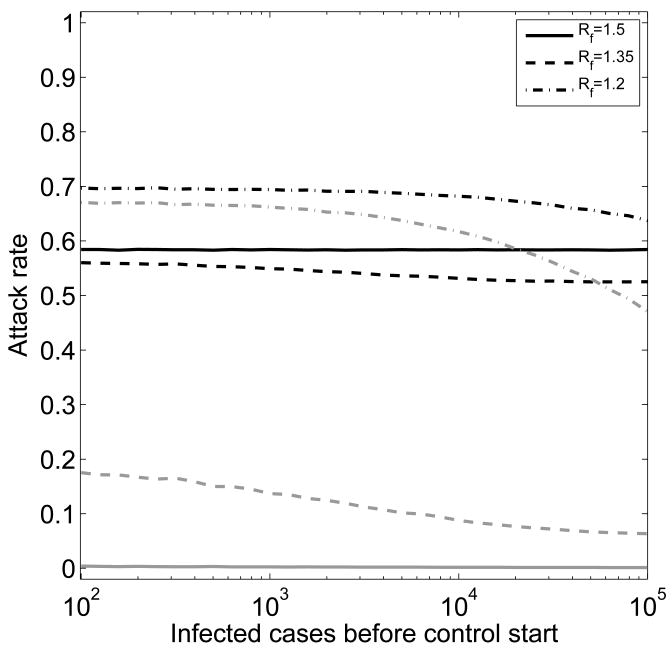
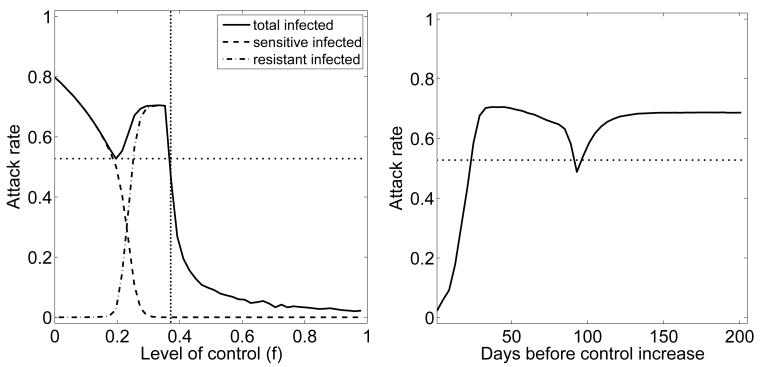
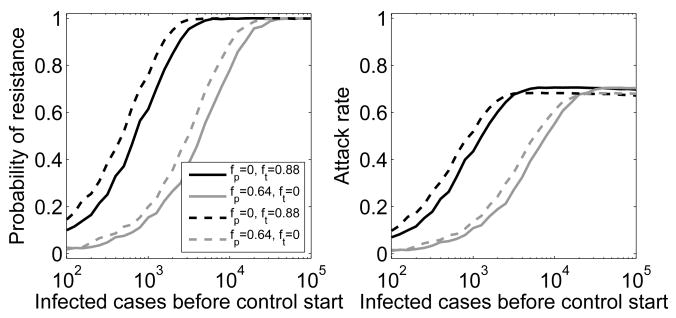
Antiviral drugs, most notably the neuraminidase inhibitors, are an important component of control strategies aimed to prevent or limit any future influenza pandemic. The potential large-scale use of antiviral drugs brings with it the danger of drug resistance evolution. A number of recent studies have shown that the emergence of drug-resistant influenza could undermine the usefulness of antiviral drugs for the control of an epidemic or pandemic outbreak. While these studies have provided important insights, the inherently stochastic nature of resistance generation and spread, as well as the potential for ongoing evolution of the resistant strain have not been fully addressed. Here, we study a stochastic model of drug resistance emergence and consecutive evolution of the resistant strain in response to antiviral control during an influenza pandemic. We find that taking into consideration the ongoing evolution of the resistant strain does not increase the probability of resistance emergence; however, it increases the total number of infecteds if a resistant outbreak occurs. Our study further shows that taking stochasticity into account leads to results that can differ from deterministic models. Specifically, we find that rapid and strong control cannot only contain a drug sensitive outbreak, it can also prevent a resistant outbreak from occurring. We find that the best control strategy is early intervention heavily based on prophylaxis at a level that leads to outbreak containment. If containment is not possible, mitigation works best at intermediate levels of antiviral control. Finally, we show that the results are not very sensitive to the way resistance generation is modeled.
Figures

Similar articles
-
Emergence of drug-resistant influenza virus: population dynamical considerations.Science. 2006 Apr 21;312(5772):389-91. doi: 10.1126/science.1122947. Science. 2006. PMID: 16627735
-
Antiviral resistance and the control of pandemic influenza.PLoS Med. 2007 Jan;4(1):e15. doi: 10.1371/journal.pmed.0040015. PLoS Med. 2007. PMID: 17253900 Free PMC article.
-
Hedging against antiviral resistance during the next influenza pandemic using small stockpiles of an alternative chemotherapy.PLoS Med. 2009 May 19;6(5):e1000085. doi: 10.1371/journal.pmed.1000085. Epub 2009 May 19. PLoS Med. 2009. PMID: 19440354 Free PMC article.
-
Fitness of neuraminidase inhibitor-resistant influenza A viruses.Curr Opin Virol. 2011 Dec;1(6):574-81. doi: 10.1016/j.coviro.2011.08.006. Epub 2011 Oct 1. Curr Opin Virol. 2011. PMID: 22440915 Free PMC article. Review.
-
[Role of neuraminidase inhibitors for the treatment of influenza A virus infections].Pathol Biol (Paris). 2010 Apr;58(2):e69-78. doi: 10.1016/j.patbio.2010.01.011. Epub 2010 Mar 19. Pathol Biol (Paris). 2010. PMID: 20303677 Review. French.
Cited by
-
Antibiotic use as a tragedy of the commons: a cross-sectional survey.Comput Math Methods Med. 2014;2014:837929. doi: 10.1155/2014/837929. Epub 2014 Jan 22. Comput Math Methods Med. 2014. PMID: 24587818 Free PMC article.
-
Modelling the emergence of influenza drug resistance: The roles of surface proteins, the immune response and antiviral mechanisms.PLoS One. 2017 Jul 10;12(7):e0180582. doi: 10.1371/journal.pone.0180582. eCollection 2017. PLoS One. 2017. PMID: 28700622 Free PMC article.
-
When does overuse of antibiotics become a tragedy of the commons?PLoS One. 2012;7(12):e46505. doi: 10.1371/journal.pone.0046505. Epub 2012 Dec 7. PLoS One. 2012. PMID: 23236344 Free PMC article.
-
A comparison of RSV and influenza in vitro kinetic parameters reveals differences in infecting time.PLoS One. 2018 Feb 8;13(2):e0192645. doi: 10.1371/journal.pone.0192645. eCollection 2018. PLoS One. 2018. PMID: 29420667 Free PMC article.
-
The timing and targeting of treatment in influenza pandemics influences the emergence of resistance in structured populations.PLoS Comput Biol. 2013;9(2):e1002912. doi: 10.1371/journal.pcbi.1002912. Epub 2013 Feb 7. PLoS Comput Biol. 2013. PMID: 23408880 Free PMC article.
References
-
- Alexander ME, Bowman CS, Feng Z, Gardam M, Moghadas SM, Rst G, Wu J, Yan P. Emergence of drug resistance: implications for antiviral control of pandemic influenza. Proc Biol Sci. Jul, 2007. pp. 1675–1684. URL http://dx.doi.org/10.1098/rspb.2007.0422. - DOI - PMC - PubMed
-
- Anderson RM, May RM. Infectious Diseases of Humans - Dynamics and Control. Oxford Science Publications; Oxford: 1991.
-
- Andersson DI, Levin BR. The biological cost of antibiotic resistance. Current Opinion in Microbiology. 1999;2:489–493. - PubMed
-
- Carrat F, Vergu E, Ferguson NM, Lemaitre M, Cauchemez S, Leach S, Valleron AJ. Time lines of infection and disease in human influenza: a review of volunteer challenge studies. Am J Epidemiol. Apr, 2008. pp. 775–785. URL http://dx.doi.org/10.1093/aje/kwm375. - DOI - PubMed
Publication types
MeSH terms
Substances
Grants and funding
LinkOut - more resources
Full Text Sources
Medical
