. 2009 Feb;1793(2):406-17.
doi: 10.1016/j.bbamcr.2008.09.011. Epub 2008 Oct 8.

Agonist-dependent phosphorylation of the formyl peptide receptor is regulated by the membrane proximal region of the cytoplasmic tail

Affiliations

Agonist-dependent phosphorylation of the formyl peptide receptor is regulated by the membrane proximal region of the cytoplasmic tail

Elena S Suvorova et al. Biochim Biophys Acta. 2009 Feb.

Abstract

Formyl peptide receptor (FPR) is a chemoattractant G protein-coupled receptor (GPCR) involved in the innate immune response against bacteria. Receptor activation is terminated by receptor phosphorylation of two serine- and threonine-rich regions located in the distal half of the cytoplasmic tail. In this study we show that introduction of an amino acid with a bulky side chain (leucine or glutamine) adjacent to a single leucine, L320, in the membrane-proximal half of the cytoplasmic tail, significantly enhanced receptor phosphorylation, beta-arrestin1/2 translocation, and receptor endocytosis, without affecting G(i)-mediated ERK1/2 activation and release of intracellular calcium. In addition, the point mutations resulted in diminished susceptibility to trypsin, suggesting a conformation different from that of wild type FPR. Alignment of the FPR sequence with the rhodopsin sequence showed that L320 resides immediately C-terminal of an amphipathic region that in rhodopsin forms helix 8. Deletion of seven amino acids (Delta309-315) from the predicted helix 8 of FPR (G307-S319) caused reduced cell signaling as well as defects in receptor phosphorylation, beta-arrestin1/2 translocation and endocytosis. Thus, the amino acid content in the N-terminal half of the cytoplasmic tail influences the structure and desensitization of FPR.


Figures

Figure 1
Figure 1. Amino acid sequences of wild type and mutant cytoplasmic tails of FPR
The serine and threonine residues in bold show the phosphorylation sites, as predicted by mutagenesis experiments [14]. The previously determined primary binding sites of two monoclonal antibodies, NFPR1 and NFPR2, are shown with lines above the amino acid sequence [8]. The deleted amino acids are indicated with a hyphen (-) and the mutated residues are in bold and underlined.
Figure 2
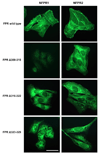
Figure 2. Two deletions of seven amino acids near the middle of the cytoplasmic tail of FPR result in protein retention in the endoplasmic reticulum
A) Immunofluorescence localization of wild type and mutant FPR in fixed and permeabilized CHO transfectants. FPR was stained with mAb NFPR1 (left column) or mAb NFPR2 (right column), followed by an Alexa™-488-conjugated secondary antibody. Bar 50 µm. B) Denatured cell extracts were incubated without enzyme (-) or in the presence of Endoglycosidase H (H) or PNGase F (F). FPR was detected in western blots with mAb NFPR2.
Figure 3
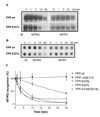
Figure 3. Wild type FPR shows a slower time course of receptor phosphorylation than the FPR mutants
A and B) Comparison of the time courses of agonist-induced phosphorylation of wild type FPR and the E321L mutant by western blot analysis. Cells were incubated for the indicated times with 100 nM fMLF. FPR was detected in conventional immunoblots (A) and dot-blots (B) with mAb NFPR2, which does not bind phosphorylated receptor, and mAb NFPR1, which binds both non-phosphorylated and phosphorylated receptor. C) Graphic representation of the increase in FPR phosphorylation shown as loss of mAb NFPR2 binding to the receptor. FPR phosphorylation was quantified from dot blots from a minimum of three experiments. The mean ± SD is shown for each time point.
Figure 4
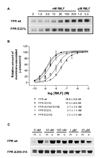
Figure 4. Wild type FPR requires a higher concentration of agonist for half maximal receptor phosphorylation than the FPR mutants
Western blot analysis of the concentration dependence of FPR phosphorylation. Cells were incubated for 5 min with various concentrations of fMLF as shown. FPR was detected as previously described (Figure 3). Non-linear regression analysis of mAb NFPR2 binding to wild type and mutant FPRs in the presence of various concentrations of ligand. EC50 is shown as mean ± SD from a minimum of three determinations.
Figure 5
Figure 5. FPR point mutants show enhanced membrane translocation of ß-arrestin1/2 in response to agonist, whereas the FPR Δ309–315 mutant does not induce ß-arrestin1/2 translocation
A) Western blot analysis of fMLF-induced translocation of ß-arrestin1/2 to cell membranes from cells expressing wild type and mutant FPR. Cells were incubated for 5 min in the presence of various concentrations of fMLF. ß-Arrestin1/2 from membrane fractions was identified using a polyclonal antibody. B) Non-linear regression analysis of the fMLF concentration dependence of ß-arrestin1/2 membrane translocation. Results were obtained by scanning western blots from a minimum of three different experiments of each cell line. EC50 is shown as mean ± SD from a minimum of three determinations. C) The amount of ß-arrestin1/2 in the membrane fraction and the cytoplasmic fraction of CHO FPR wild type and Δ309–315 mutant was compared. Cells were incubated for 5 min in the presence of various concentrations of fMLF, as shown. ß-Arrestin1/2 from membrane fractions (m) and cytoplasmic fractions (c) was identified using a polyclonal antibody, as above.
Figure 6
Figure 6. Enhanced receptor phosphorylation and ß-arrestin1/2 membrane translocation correlate with increased endocytosis
A) Flow cytometric analysis of endocytosed FPR. Cells were incubated for 15 min at 37°C in the presence or absence of 100 nM fMLF, washed to remove remaining ligand, and incubated with a fluorescent formylated hexapeptide to detect FPR remaining on the cell surface. The data are shown as percentage of binding sites on the cell surface, compared to cells incubated in the absence of fMLF. Data show means ± SD from a minimum of three different experiments. P = 0.0057 (non-parametric one-way ANOVA). B) Immunofluorescence analysis of total FPR after 0 or 10 min incubation with fMLF. Methanol fixed and permeabilized cells were incubated with mAb NFPR1 and fluorescent secondary antibody to stain total FPR. (Results for FPR Δ309–315 are not shown since mAb NFPR1 does not bind the mutant receptor.) C) Immunofluorescence analysis of non-phosphorylated FPR after 0, 10 or 60 min incubation with fMLF. Methanol fixed and permeabilized cells were incubated with mAb NFPR2 and fluorescent secondary antibody to stain non-phosphorylated FPR. Bar 50 µm.
Figure 7
Figure 7. FPR point mutants show similar activation of ERK1/2 as wild type FPR
A) Western blot analysis of the time course of ERK1/2 activation. Cells were incubated in the presence of 100 nM fMLF for 0, 2, 5, 10 or 30 min. Phosphorylated ERK1/2 was visualized using an antibody that recognizes ERK1/2 phosphorylated on Thr202/Tyr204 (left column) and total ERK1/2 was visualized using an antibody that recognizes both non-phosphorylated and phosphorylated receptor (right column). B) Western blot analysis of the fMLF concentration dependence of ERK1/2 activation. Cells were incubated for 5 min with various concentrations of fMLF, as shown. Phosphorylated and total ERK1/2 was visualized as above. C) Quantification of the relative amount of phosphorylated ERK1/2 in response to 5 min incubation with various concentrations of fMLF. The results are means ± SD from a minimum of three different experiments for each receptor.
Figure 8
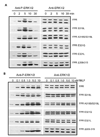
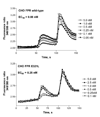
Figure 8. CHO FPR wild type and CHO FPR E321L show similar calcium curves in response to fMLF
Cells loaded with Fura 2-AM were induced to release intracellular calcium by the addition of various concentrations of fMLF at 50 s, as shown. 10 µM ATP was added at 100 s to provide a standard stimulus for calcium release.
Figure 9
Figure 9. Computational prediction of the helical structure in the membrane proximal region of the cytoplasmic tail of FPR
Amino acid sequences of bovine rhodopsin (N301-G328), human C5aR (N296-T324) and human FPR (N297-T325) were aligned (vertical line) relative to the 7th transmembrane domain (TM7). The position of helix 8 of rhodopsin is based on the resolved crystal structure [17]. Star (*) indicates identical amino acids in all three sequences. Two dots (:) indicates tolerable amino acid substitutions, and one dot (.) indicates amino acid residues of similar size. The numbers underlying the sequences represent the rate of confidence for helical structure provided by PSIpred and APSS2 servers. Higher number stands for higher confidence. Hyphen (-) represents the highest confidence of 10, used in the APSS2 prediction. Dotted line (…..) underlines the sequence of the putative helix 8, as predicted by PSIpred and APSS2 analysis.
Figure 10
Figure 10. Wild type FPR is more susceptible to proteolysis than mutant FPRs
Triton X-100 solubilized membranes of CHO transfectants were treated with 0–10 ng/µl trypsin, as shown. Samples were analyzed in western blots using NFPR2 antibody. A) Representative western blots of the proteolysis of wild type FPR and FPR E321L mutant. B) Proteolysis was quantified from western blots by scanning. The graph on the left shows the decrease in the amount of intact and high molecular weight (HMW) FPR bands and the graph on the right shows the initial increase and the subsequent decrease in the amount of the proteolytic low molecular weight (LMW) FPR bands. The data are means ± SD from three different experiments.

Similar articles

Cited by

References

    1. Rabiet MJ, Huet E, Boulay F. The N-formyl peptide receptors and the anaphylatoxin C5a receptors: an overview. Biochimie. 2007;89:1089. - PMC - PubMed
    1. Gurevich VV, Gurevich EV. The structural basis of arrestin-mediated regulation of G-protein-coupled receptors. Pharmacol. Ther. 2006;110:465. - PMC - PubMed
    1. Suvorova ES, Gripentrog JM, Oppermann M, Miettinen HM. Role of the carboxyl terminal di-leucine in phosphorylation and internalization of C5a receptor. Biochim. Biophys. Acta. 2008;1783:1261. - PMC - PubMed
    1. Anelli T, Sitia R. Protein quality control in the early secretory pathway. EMBO J. 2008;27:315. - PMC - PubMed
    1. Marchese A, Paing MM, Temple BR, Trejo J. G protein-coupled receptor sorting to endosomes and lysosomes. Annu. Rev. Pharmacol. Toxicol. 2008;48:601. - PMC - PubMed

Publication types

MeSH terms

LinkOut - more resources