. 2008 Oct;20(10):2763-82.
doi: 10.1105/tpc.108.061325. Epub 2008 Oct 24.

A battery of transcription factors involved in the regulation of secondary cell wall biosynthesis in Arabidopsis

Affiliations

A battery of transcription factors involved in the regulation of secondary cell wall biosynthesis in Arabidopsis

Ruiqin Zhong et al. Plant Cell. 2008 Oct.

Abstract

SECONDARY WALL-ASSOCIATED NAC DOMAIN PROTEIN1 (SND1) is a master transcriptional switch activating the developmental program of secondary wall biosynthesis. Here, we demonstrate that a battery of SND1-regulated transcription factors is required for normal secondary wall biosynthesis in Arabidopsis thaliana. The expression of 11 SND1-regulated transcription factors, namely, SND2, SND3, MYB103, MYB85, MYB52, MYB54, MYB69, MYB42, MYB43, MYB20, and KNAT7 (a Knotted1-like homeodomain protein), was developmentally associated with cells undergoing secondary wall thickening. Of these, dominant repression of SND2, SND3, MYB103, MYB85, MYB52, MYB54, and KNAT7 significantly reduced secondary wall thickening in fiber cells. Overexpression of SND2, SND3, and MYB103 increased secondary wall thickening in fibers, and overexpression of MYB85 led to ectopic deposition of lignin in epidermal and cortical cells in stems. Furthermore, SND2, SND3, MYB103, MYB85, MYB52, and MYB54 were able to induce secondary wall biosynthetic genes. Direct target analysis using the estrogen-inducible system revealed that MYB46, SND3, MYB103, and KNAT7 were direct targets of SND1 and also of its close homologs, NST1, NST2, and vessel-specific VND6 and VND7. Together, these results demonstrate that a transcriptional network consisting of SND1 and its downstream targets is involved in regulating secondary wall biosynthesis in fibers and that NST1, NST2, VND6, and VND7 are functional homologs of SND1 that regulate the same downstream targets in different cell types.


Figures
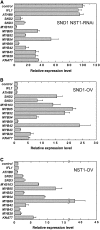
Figure 1.
Figure 1.
SND1 Regulates the Expression of a Set of Transcription Factor Genes. Two genes, IFL1 and ATHB8, which are not regulated by SND1 (Zhong et al., 2006), were included for comparison. Except for IFL1 and ATHB8, the quantitative differences of expression of transcription factors between the wild type (control) and transgenic lines are statistically significant (P < 0.001). Error bars represent the se of three biological replicates. (A) Real-time quantitative PCR analysis showing a reduction in the expression of the transcription factor genes in the stems of SND1 and NST1 double RNAi plants (SND1 NST1-RNAi) relative to expression of these transcription factors in the wild type (control), which is set to 100. (B) and (C) Real-time quantitative PCR analysis showing an induction in the expression of the transcription factors in the leaves of SND1 overexpressors (SND1-OV; [B]) and NST1 overexpressors (NST1-OV; [C]). The expression level of these transcription factors in the wild type (control) was set to 1.
Figure 2.
Figure 2.
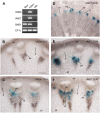
Quantitative Real-Time PCR Analysis of the Expression of SND2, SND3, MYB103, MYB85, MYB52, and MYB54 Genes in Different Cell Types and Organs. Pith, xylem, and interfascicular fiber cells were dissected from Arabidopsis inflorescence stems. The expression level of the transcription factor genes in pith cells was set to 1 for comparative expression analysis in different cell types. The expression level of the transcription factor genes in the organ with the lowest expression level was set to 1 for comparative expression analysis in different organs. Error bars represent the se of three biological replicates.
Figure 3.
Figure 3.
Quantitative Real-Time PCR Analysis of the Expression of MYB69, MYB42, MYB43, MYB20, and KNAT7 Genes in Different Cell Types and Organs. The expression level of the transcription factor genes in pith cells was set to 1 for comparative expression analysis in different cell types. The expression level of the transcription factor genes in the organ with the lowest expression level was set to 1 for comparative expression analysis in different organs. Error bars represent the se of three biological replicates.
Figure 4.
Figure 4.
Expression Patterns of SND2, SND3, MYB103, and MYB85 Genes in Arabidopsis Stems and Roots. Transgenic Arabidopsis plants expressing the transcription factor-GUS reporter genes were examined for GUS activity. Cross sections of elongating internodes ([A], [D], [G], and [J]) nonelongating internodes ([B], [E], [H], and [K]), and roots ([C], [F], [I], and [L]), showing the expression of SND2 ([A] to [C]), SND3 ([D] to [F]), MYB103 ([G] to [I]), and MYB85 ([J] to [L]) in developing vessels, xylary fibers, and interfascicular fibers in stems ([A], [B], [D], [E], [G], [H], [J], and [K]), and in developing secondary xylem cells in the root ([C], [F], [I], and [L]). co, cortex; if, interfascicular fiber; mx, metaxylem; pi, pith; px, protoxylem; sp, secondary phloem; sx, secondary xylem. Bar in (A) = 160 μm for (A) to (L).
Figure 5.
Figure 5.
Expression Patterns of MYB52, MYB54, MYB69, and KNAT7 Genes in Arabidopsis Stems and Roots. The expression of the transcription factor genes was studied using the GUS reporter gene ([A] to [F]) or in situ mRNA hybridization ([G] to [L]). Cross sections of elongating internodes ([A], [D], [G], and [J]), nonelongating internodes ([B], [E], [H], and [K]), and roots ([C], [F], [I], and [L]) showing the expression of MYB52 ([A] to [C]), MYB54 ([D] to [F]), MYB69 ([G] to [I]), and KNAT7 ([J] to [L]) in developing vessels, xylary fibers, and interfascicular fibers in stems ([A], [B], [D], [E], [G], [H], [J], and [K]), and in developing secondary xylem cells in the root ([C], [F], [I], and [L]). co, cortex; if, interfascicular fiber; mx, metaxylem; pi, pith; px, protoxylem; sp; secondary phloem; sx, secondary xylem. Bar in (A) = 160 μm for (A) to (F), and bar in (G) = 78 μm for (G) to (L).
Figure 6.
Figure 6.
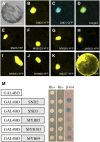
Subcellular Localization and Transcriptional Activation Analysis of the Secondary Wall–Associated Transcription Factors. Subcellular localization was determined by expressing YFP-tagged transcription factors in Arabidopsis leaf protoplasts. For the transcriptional activation analysis, full-length cDNAs of transcription factors fused with the GAL4-DNA binding domain were expressed in yeast and tested for activation of expression of the His3 and β-Gal reporter genes. Bar in (A) = 25 μm for (A) to (L). (A) to (D) An Arabidopsis protoplast coexpressing SND2-YFP and SND1-CFP. The differential interference contrast image (A), the SND2-YFP signal (B), the SND1-cyan fluorescent protein (CFP) signal (C), and the merged image (D) of (B) and (C) are shown. Note that SND2-YFP colocalizes with SND1-CFP in the nucleus. (E) to (K) Arabidopsis protoplasts expressing SND3-YFP (E), MYB103-YFP (F), MYB85-YFP (G), MYB52-YFP (H), MYB54-YFP (I), MYB69-YFP (J), and KNAT7-YFP (K), showing their nuclear localization. (L) An Arabidopsis protoplast expressing YFP alone showing the fluorescent signal throughout the cytoplasm and in the nucleus. (M) Transcriptional activation analysis of secondary wall–associated transcription factors fused with the GAL4 DNA binding domain (GAL4DB) in yeast. SND2, SND3, MYB85, MYB103, and MYB69 were able to activate the expression of the His3 and β-Gal reporter genes.
Figure 7.
Figure 7.
Effects of Dominant Repression of SND2, SND3, MYB103, and MYB85 on Secondary Wall Thickening in Fibers. The full-length cDNAs of SND2, SND3, MYB103, and MYB85 were fused in frame with the dominant EAR repression sequence (DR) and expressed in Arabidopsis plants. The bottom internodes of 8-week-old transgenic plants were examined for secondary wall thickening in fibers and vessels. co, cortex; if, interfascicular fiber; ph, phloem; ve, vessel; xf, xylary fiber. Bar in (A) = 78 μm for the light micrographs ([A], [C], [E], [G], [I], [K], [M], [O], [Q], and [S]), and bar in (B) = 8.1 μm for the transmission electron micrographs ([B], [D], [F], [H], [J], [L], [N], [P], [R], and [T]). (A) to (D) Cross sections of wild-type stems showing secondary wall thickening in xylary fibers and vessels ([A] and [B]) and in interfascicular fibers ([C] and [D]). (E) to (T) Cross sections of SND2-DR ([E] to [H]), SND3-DR ([I] to [L]), MYB103-DR ([M] to [P]), and MYB85-DR ([Q] to [T]) stems showing reduced secondary wall thickening in xylary fibers ([E], [F], [I], [J], [M], [N], [Q], and [R]) and in interfascicular fibers ([G], [H], [K], [L], [O], [P], [S], and [T]).
Figure 8.
Figure 8.
Effects of Dominant Repression of MYB52, MYB54, MYB69, and KNAT7 on Secondary Wall Thickening in Fibers. The full-length cDNAs of MYB52, MYB54, MYB69, and KNAT7 were fused in frame with the dominant EAR repression sequence (DR) and expressed in Arabidopsis plants. The bottom internodes of 8-week-old transgenic plants were examined for the secondary wall thickening in fibers and vessels. Cross sections of MYB52-DR ([A] to [D]), MYB54-DR ([E] to [H]), MYB69-DR ([I] to [L]), and KNAT7-DR ([M] to [P]) stems showing reduced secondary wall thickening in xylary fibers ([A], [B], [E], [F], [I], [J], [M], and [N]) and in interfascicular fibers ([C], [D], [G], [H], [K], [L], [O], and [P]). co, cortex; if, interfascicular fiber; ph, phloem; ve, vessel; xf, xylary fiber. Bar in (A) = 78 μm for the light micrographs ([A], [C], [E], [G], [I], [K], [M], and [O]), and bar in (B) = 8.1 μm for the transmission electron micrographs ([B], [D], [F], [H], [J], [L], [N], and [P]).
Figure 9.
Figure 9.
Effects of Overexpression of SND2, SND3, MYB103, and MYB85 on Secondary Wall Deposition. The full-length cDNAs of SND2, SND3, MYB103, and MYB85 driven by the CaMV 35S promoter were overexpressed (OV) in Arabidopsis plants. The bottom internodes of 8-week-old transgenic plants were examined for alterations in secondary wall deposition. co, cortex; if, interfascicular fiber; ph, phloem; ve, vessel; xf, xylary fiber; xy, xylem. Bar in (A) = 78 μm for the light micrographs ([A], [C], [E], [G], [I], [K], [M], [O], [Q], and [R]), and bar in (B) = 8.1 μm for the transmission electron micrographs ([B], [D], [F], [H], [J], [L], [N], and [P]). (A) to (D) Cross sections of wild-type stems, showing secondary wall thickening in xylary fibers and vessels ([A] and [B]) and in interfascicular fibers ([C] and [D]). (E) to (P) Cross sections of SND2-OV ([E] to [H]), SND3-OV ([I] to [L]), and MYB103-OV ([M] to [P]) stems, showing increased secondary wall thickening in xylary fibers ([E], [F], [I], [J], [M], and [N]) and in interfascicular fibers ([G], [H], [K], [L], [O], and [P]). (Q) and (R) Cross sections of stems, showing ectopic lignin deposition in the epidermal and cortical cell walls of MYB85-OV (R) compared with the wild type (Q). Lignified walls were stained (red) with phloroglucinol-HCl.
Figure 10.
Figure 10.
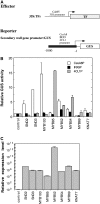
Induction of Secondary Wall Biosynthetic Genes by Secondary Wall–Associated Transcription Factors. The secondary wall–associated transcription factors were coexpressed in Arabidopsis leaf protoplasts with the GUS reporter gene driven by the CesA8, IRX9, or 4CL1 promoter. The induction of GUS gene expression by the transcription factors was measured by assaying the GUS activity. (A) Diagrams of the effector and reporter constructs used for the expression analysis. The effector constructs contain the secondary wall–associated transcription factors (TFs) driven by the CaMV 35S promoter. The reporter constructs consist of the GUS reporter gene driven by the promoters of three representative secondary wall biosynthetic genes, CesA8, IRX9, and 4CL1. (B) Transactivation analysis showing the effects of secondary wall–associated transcription factors on the induction of the GUS reporter gene driven by the promoter of CesA8, IRX9, or 4CL1. The expression level of the GUS reporter gene in protoplasts transfected with the reporter construct alone was used as a control and was set to 1. Error bars represent se of three biological replicates. (C) Real-time quantitative PCR analysis showing that the effector genes were highly expressed in the protoplasts cotransfected with the reporter and the individual effector constructs. The expression level of these transcription factors in protoplasts transfected with the reporter construct alone was used as a control and was set to 1. Error bars represent the se of three biological replicates.
Figure 11.
Figure 11.
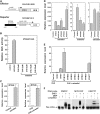
SND1 Directly Activates the Expression of the SND3, MYB103, and KNAT7 Genes. SND1 fused with the regulatory region of HER was expressed under the control of the CaMV 35S promoter in Arabidopsis leaf protoplasts. The protoplasts were treated with estradiol, cycloheximide (CHX), or CHX plus estradiol. Without estradiol treatment, the SND1-HER chimeric protein is inactive since it is trapped in the cytoplasm through binding to a cytoplasmic complex. When estradiol is applied, the SND1 chimeric protein is released and thus can enter the nucleus to regulate the expression of its downstream target genes. In the presence of the protein synthesis inhibitor cycloheximide, estradiol activation of SND1 can still induce the expression of its direct target genes since this induction does not require new protein synthesis. The expression of the transcription factor genes was detected by real-time quantitative PCR analysis. Error bars represent the se of three biological replicates. (A) Diagram of the SND1 construct and the reporter construct used for direct target analysis. The SND1 construct (35S:SND1-HER) contains SND1 translationally fused with the regulatory region of HER and is driven by the CaMV 35S promoter. The reporter construct consists of the GUS reporter gene driven by the MYB46 promoter linked with the CaMV 35S minimal promoter sequence. (B) Transactivation analysis showing that the estradiol-activated SND1 induced MYB46 promoter–driven GUS reporter activity, and this induction was completely abolished by addition of the protein synthesis inhibitor cycloheximide (CHX). Arabidopsis leaf protoplasts transfected with the reporter (MYB46P:GUS), and effector (35S:SND1-HER) constructs were treated with estradiol (2 μM), cycloheximide (2 μM), or with estradiol together with various concentrations (2, 5, 10, and 20 μM) of cycloheximide. The GUS activity in the mock-treated (control) protoplasts was set to 1. (C) Direct activation of MYB46 expression by SND1. The MYB46 gene was drastically induced by estradiol treatment in protoplasts expressing SND1-HER (left panel; the expression level in the mock-treated [control] protoplasts was set to 1). Direct activation of MYB46 by SND1 was demonstrated by inhibition of new protein synthesis with cyclohexamide during estradiol treatment (right panel; the expression level in the CHX-treated protoplasts was set to 1). (D) The expression of secondary wall–associated transcription factors was highly induced by estradiol treatment in protoplasts expressing SND1-HER. The expression level in the mock-treated (control) protoplasts was set to 1. (E) The expression of SND3, MYB103, and KNAT7 is directly activated by SND1 in the absence of new protein synthesis in protoplasts expressing SND1-HER. The expression level in the CHX-treated protoplasts was set to 1. (F) EMSA of SND1 binding to the promoter fragments of SND3, MYB103, and KNAT7 genes. The NAC domain of SND1 fused with maltose binding protein (MBP) was incubated with biotin-labeled promoter fragments (located between −600 and −1 relative to the start codon) and subjected to EMSA by polyacrylamide gel electrophoresis. The biotin-labeled DNA fragments were detected with the chemiluminescence method. MBP was used as a control protein. For competition analysis, unlabeled corresponding promoter fragments (competitors) in 20-fold (+) molar excess relative to the labeled probes were included in the reactions.
Figure 12.
Figure 12.
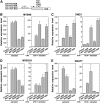
Direct Activation of the MYB46, SND3, MYB103, and KNAT7 Genes by SND1 Homologs. SND1 homologs, NST1, NST2, VND6, and VND7, were fused with the regulatory region of the human estrogen receptor, and the fusion proteins were expressed in Arabidopsis leaf protoplasts. The protoplasts were treated with CHX alone (control) or CHX plus estradiol. The expression of the transcription factor genes was detected by real-time quantitative PCR analysis. The expression level of each gene in the mock-treated (control) or CHX-treated protoplasts was set to 1. Error bars represent the se of three biological replicates. (A) Diagram of the NST1, NST2, VND6, and VND7 constructs used for direct target analysis. The constructs (35S:NST1-HER, 35S:NST2-HER, 35S:VND6-HER, and 35S:VND7-HER) consist of NST1, NST2, VND6, and VND7 translationally fused with the regulatory region of HER and driven by the CaMV 35S promoter. (B) to (E) The expression of MYB46 (B), SND3 (C), MYB103 (D), and KNAT7 (E) was induced by estradiol treatment of protoplasts expressing NST1-HER, NST2-HER, VND6-HER, and VND7-HER in the absence (left panels) or presence (right panels) of cycloheximide.
Figure 13.
Figure 13.
Expression Patterns of the VND6 and VND7 Genes in Arabidopsis Inflorescence Stems. The expression patterns of the VND6 and VND7 genes were examined using RT-PCR and GUS reporter gene analyses. The VND6 and VND7 genes, including a 3-kb 5′ upstream sequence, the entire coding region, and a 2-kb 3′downstream sequence, were fused with the GUS reporter gene, and the expression constructs (VND6:GUS and VND7:GUS) were transformed into Arabidopsis plants for expression analysis. co, cortex; if, interfascicular fiber; pi, pith; px, protoxylem; ve, vessel; xf, xylary fiber. Bar in (B) = 56 m for (B) to (F). (A) RT-PCR analysis of the expression of VND6 and VND7 in laser-dissected cells showing their specific expression in xylem but not in interfascicular fibers or pith cells compared with SND1 expression in both xylem and interfascicular fibers. The expression of the EF1α gene is shown as an internal control. Shown are the representative data from three biological replicates. (B) Cross section of an elongating internode of VND6:GUS plants showing the absence of GUS staining. (C) Cross section of a nonelongating internode of VND6:GUS plants showing GUS staining in developing vessels but not in xylary fibers of the metaxylem or interfascicular fibers. (D) Cross section of a root of VND7:GUS plants showing GUS staining in developing vessels but not in xylary fibers of the secondary xylem. (E) Cross section of an elongating internode of VND7:GUS plants showing GUS staining in vessels of the protoxylem. (F) Cross section of a nonelongating internode of VND7:GUS plants showing GUS staining in developing vessels but not in xylary fibers of the metaxylem or interfascicular fibers.
Figure 14.
Figure 14.
Diagram of the Transcriptional Network Regulating Secondary Wall Biosynthesis in Different Cell Types. SND1, NST1, NST2, VND6, and VND7 are cell type–specific, functionally redundant master switches activating the entire secondary wall biosynthetic program. They induce the expression of the same set of downstream transcription factors. Among them, MYB46, SND3, MYB103, and KNAT7 are the direct targets of these master switches. MYB46 is also able to activate the entire secondary wall biosynthetic program. It is proposed that these master switches activate a cascade of transcription factors, which in turn induce the expression of the biosynthetic genes for secondary wall components, including cellulose, xylan, and lignin.

References

    1. Baudry, A., Heim, M.A., Dubreucq, B., Caboche, M., Weisshaar, B., and Lepiniec, L. (2004). TT2, TT8, and TTG1 synergistically specify the expression of BANYULS and proanthocyanidin biosynthesis in Arabidopsis thaliana. Plant J. 39 366–380. - PubMed
    1. Bechtold, N., and Bouchez, D. (1994). In planta Agrobacterium-mediated transformation of adult Arabidopsis thaliana plants by vacuum infiltration. In Gene Transfer to Plants, I. Potrykus, and G. Spangenberg, eds (Berlin: Springer-Verlag), pp. 19–23.
    1. Bedon, F., Grima-Pettenati, J., and Mackay, J. (2007). Conifer R2R3-MYB transcription factors: Sequence analyses and gene expression in wood-forming tissues of white spruce (Picea glauca). BMC Plant Biol. 7 17. - PMC - PubMed
    1. Boerjan, W., Ralph, J., and Baucher, M. (2003). Lignin biosynthesis. Annu. Rev. Plant Biol. 54 519–546. - PubMed
    1. Burk, D.H., Zhong, R., Morrison, W.H.I.I.I., and Ye, Z.-H. (2006). Disruption of cortical microtubules by overexpression of green fluorescent protein-tagged α-tubulin 6 causes a marked reduction in cell wall synthesis. J. Integr. Plant Biol. 48 85–98.

Publication types

MeSH terms