

Mean mass-specific metabolic rates are strikingly similar across life's major domains: Evidence for life's metabolic optimum
- PMID: 18952839
- PMCID: PMC2572558
- DOI: 10.1073/pnas.0802148105
Mean mass-specific metabolic rates are strikingly similar across life's major domains: Evidence for life's metabolic optimum
Abstract
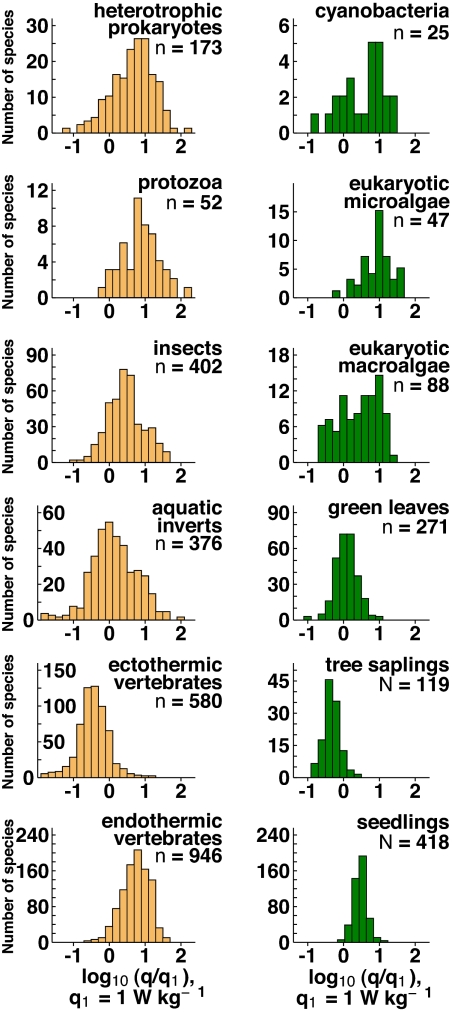
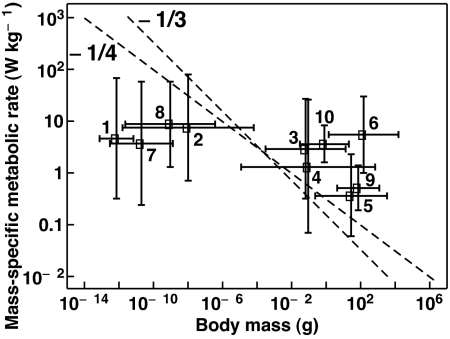
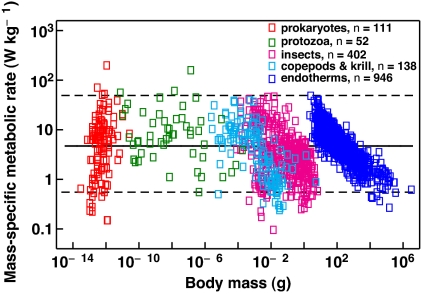
A fundamental but unanswered biological question asks how much energy, on average, Earth's different life forms spend per unit mass per unit time to remain alive. Here, using the largest database to date, for 3,006 species that includes most of the range of biological diversity on the planet-from bacteria to elephants, and algae to sapling trees-we show that metabolism displays a striking degree of homeostasis across all of life. We demonstrate that, despite the enormous biochemical, physiological, and ecological differences between the surveyed species that vary over 10(20)-fold in body mass, mean metabolic rates of major taxonomic groups displayed at physiological rest converge on a narrow range from 0.3 to 9 W kg(-1). This 30-fold variation among life's disparate forms represents a remarkably small range compared with the 4,000- to 65,000-fold difference between the mean metabolic rates of the smallest and largest organisms that would be observed if life as a whole conformed to universal quarter-power or third-power allometric scaling laws. The observed broad convergence on a narrow range of basal metabolic rates suggests that organismal designs that fit in this physiological window have been favored by natural selection across all of life's major kingdoms, and that this range might therefore be considered as optimal for living matter as a whole.
Conflict of interest statement
The authors declare no conflict of interest.
Figures
References
-
- Hemmingsen AM. Energy metabolism as related to body size and respiratory surfaces, and its evolution. Rep Steno Mem Hosp. 1960;9:1–110.
-
- Peters RH. The Ecological Implications of Body Size. Cambridge, UK: Cambridge Univ Press; 1983.
-
- Clarke A, Johnston NM. Scaling of metabolic rate with body mass and temperature in teleost fish. J Anim Ecol. 1999;68:893–905.
-
- Darveau C-A, Suarez RK, Andrews RD, Hochachka PW. Allometric cascade as a unifying principle of body mass effects on metabolism. Nature. 2002;417:166–170. - PubMed
-
- Brown JH, et al. Toward a metabolic theory of ecology. Ecology. 2004;85:1771–1789.
Publication types
MeSH terms
LinkOut - more resources
Full Text Sources
