Comparative Study
. 2008 Dec;148(4):1772-81.
doi: 10.1104/pp.108.124867. Epub 2008 Oct 24.

Finding and comparing syntenic regions among Arabidopsis and the outgroups papaya, poplar, and grape: CoGe with rosids

Affiliations
Comparative Study

Finding and comparing syntenic regions among Arabidopsis and the outgroups papaya, poplar, and grape: CoGe with rosids

Eric Lyons et al. Plant Physiol. 2008 Dec.

Abstract

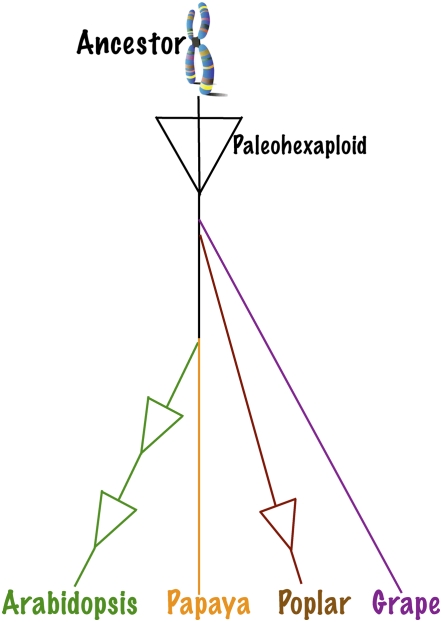
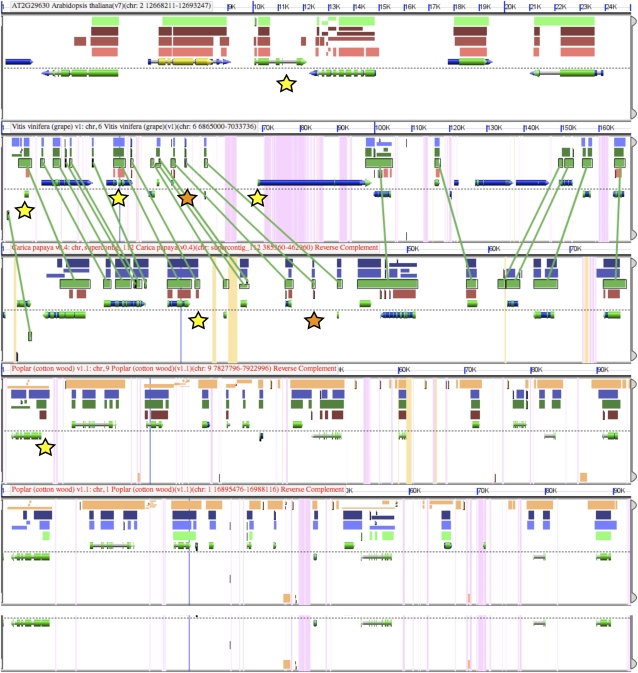
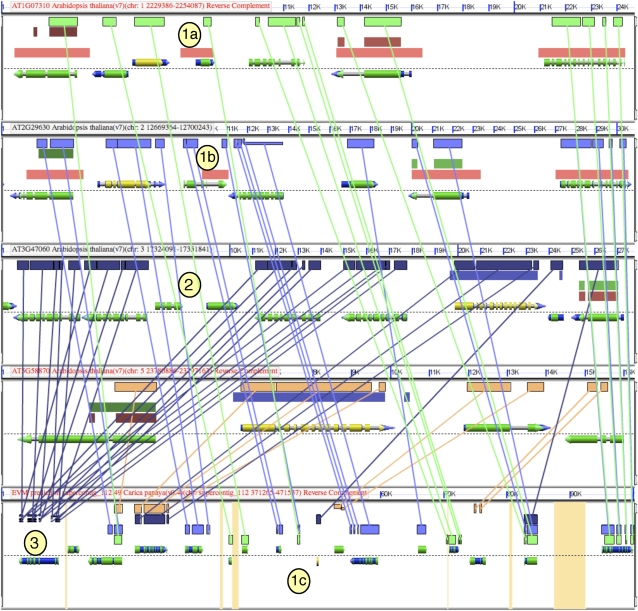
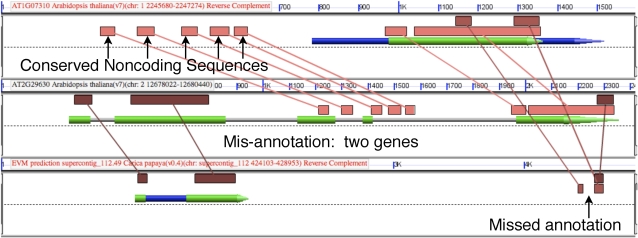
In addition to the genomes of Arabidopsis (Arabidopsis thaliana) and poplar (Populus trichocarpa), two near-complete rosid genome sequences, grape (Vitis vinifera) and papaya (Carica papaya), have been recently released. The phylogenetic relationship among these four genomes and the placement of their three independent, fractionated tetraploidies sum to a powerful comparative genomic system. CoGe, a platform of multiple whole or near-complete genome sequences, provides an integrative Web-based system to find and align syntenic chromosomal regions and visualize the output in an intuitive and interactive manner. CoGe has been customized to specifically support comparisons among the rosids. Crucial facts and definitions are presented to clearly describe the sorts of biological questions that might be answered in part using CoGe, including patterns of DNA conservation, accuracy of annotation, transposability of individual genes, subfunctionalization and/or fractionation of syntenic gene sets, and conserved noncoding sequence content. This précis of an online tutorial, CoGe with Rosids (http://tinyurl.com/4a23pk), presents sample results graphically.


Figures

Figure 1.
Figure 1.
Rosid phylogenetic tree from MOBOT decorated with fractionated WGD events. References are in text. If grape is not an official rosid, it is a close outgroup. WGD events are shown as triangles because they are subsequently fractionated so the majority of duplicated genes were removed. The branch lengths that position the tetraploidy events relate to relative divergence times and not to absolute time elapsed, and are drawn to highlight lineage-specific genome duplication events.
Figure 2.
Figure 2.
A screenshot of the BLASTz output from a syntenic comparison among chromosomal regions of Arabidopsis, papaya, and grape and two regions of poplar derived from its most recent genome duplication event. Each horizontal image is a visualization of one genomic region. The dashed line in the middle of each region represents the division between the top (5′ on left) and the bottom (5′ on right) strand. Gene models are drawn as colored arrows directly above or below this line, with CDS colored green, RNA blue, and the full gene model as gray to show introns. BLASTz was used to find regions of similarity (i.e. BLAST hits) between all pairwise sequence comparisons and are drawn as colored blocks above or below gene models, with each color representing one pairwise comparison. BLAST hits in the (++) and (+−) orientation are drawn above and below the dashed line, respectively. Green lines are drawn connecting BLAST hits between grape and papaya (second and third genomic regions, respectively). Such collinearity of BLAST hits is evidence for synteny, which is a pattern repeated between all pairwise comparisons of these genomic regions. Gold and orange stars highlight possible annotation errors and missing annotations, respectively, based on discordance of gene models and regions of sequence similarity. Results can be regenerated using http://tinyurl.com/4n3npz and research might be resumed.
Figure 3.
Figure 3.
A screenshot of the BLASTz output for a syntenic comparison among four Arabidopsis regions and one papaya region (top to bottom). Figure attributes are as described in the Figure 2 legend. Orange in the background of the papaya genomic region indicates unsequenced regions. Lines connecting regions of sequence similarity have been drawn between each Arabidopsis region and papaya. Circled numbers refer to (1) possible annotation error evidenced by sequence similarity between two regions of Arabidopsis (1a, 1b) and papaya (1c); (2) insertion into a tandem array of locally duplicated genes; and (3) evidence for local duplication in Arabidopsis lineage due to multiple genes mapping to the same region in papaya. This research can be revisited at http://tinyurl.com/2vzcsk.
Figure 4.
Figure 4.
A screenshot of BLASTn output for the comparison among two Arabidopsis regions and one papaya region to identify errors in gene annotations; settings include a false-positive noise cutoff requiring hits to be as or more significant than a 15/15-bp exact nucleotide match (Thomas et al., 2007). Figure attributes are as described in the Figure 2 legend. The research can be revisited at http://tinyurl.com/4lqjdd.

References

    1. Adams KL, Wendel JF (2005) Polyploidy and genome evolution in plants. Curr Opin Plant Biol 8 135–141 - PubMed
    1. Altschul SF, Gish W, Miller W, Myers EW, Lipman DJ (1990) Basic local alignment search tool. J Mol Biol 215 403–410 - PubMed
    1. Ameline-Torregrosa C, Wang BB, O'Bleness MS, Deshpande S, Zhu H, Roe B, Young ND, Cannon SB (2007) Identification and characterization of NBS-LRR genes in the model plant Medicago truncatula. Plant Physiol 146 5–21 - PMC - PubMed
    1. Birchler JA, Riddle NC, Auger DL, Veitia RA (2005) Dosage balance in gene regulation: biological implications. Trends Genet 21 219–226 - PubMed
    1. Blanc G, Wolfe KH (2004) Functional divergence of duplicated genes formed by polyploidy during Arabidopsis evolution. Plant Cell 16 1679–1691 - PMC - PubMed

Publication types

LinkOut - more resources