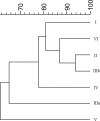
Rapid classification and identification of salmonellae at the species and subspecies levels by whole-cell matrix-assisted laser desorption ionization-time of flight mass spectrometry
- PMID: 18952875
- PMCID: PMC2607147
- DOI: 10.1128/AEM.01402-08
Rapid classification and identification of salmonellae at the species and subspecies levels by whole-cell matrix-assisted laser desorption ionization-time of flight mass spectrometry
Abstract
Variations in the mass spectral profiles of multiple housekeeping proteins of 126 strains representing Salmonella enterica subsp. enterica (subspecies I), S. enterica subsp. salamae (subspecies II), S. enterica subsp. arizonae (subspecies IIIa), S. enterica subsp. diarizonae (subspecies IIIb), S. enterica subsp. houtenae (subspecies IV), and S. enterica subsp. indica (subspecies VI), and Salmonella bongori were analyzed to obtain a phylogenetic classification of salmonellae based on whole-cell matrix-assisted laser desorption ionization-time of flight mass spectrometric bacterial typing. Sinapinic acid produced highly informative spectra containing a large number of biomarkers and covering a wide molecular mass range (2,000 to 40,000 Da). Genus-, species-, and subspecies-identifying biomarker ions were assigned on the basis of available genome sequence data for Salmonella, and more than 200 biomarker peaks, which corresponded mainly to abundant and highly basic ribosomal or nucleic acid binding proteins, were selected. A detailed comparative analysis of the biomarker profiles of Salmonella strains revealed sequence variations corresponding to single or multiple amino acid changes in multiple housekeeping proteins. The resulting mass spectrometry-based bacterial classification was very comparable to the results of DNA sequence-based methods. A rapid protocol that allowed identification of Salmonella subspecies in minutes was established.
Figures


References
-
- Arnold, R. J., and J. P. Reilly. 1998. Fingerprint matching of E. coli strains with matrix-assisted laser desorption/ionization time-of-flight mass spectrometry of whole cells using a modified correlation approach. Rapid Commun. Mass Spectrom. 12:630-636. - PubMed
-
- Arnold, R. J., and J. P. Reilly. 1999. Observation of Escherichia coli ribosomal proteins and their posttranslational modifications by mass spectrometry. Anal. Biochem. 269:105-112. - PubMed
-
- Camara, J. E., and F. A. Hays. 2007. Discrimination between wild-type and ampicillin-resistant Escherichia coli by matrix-assisted laser desorption/ionization time-of-flight mass spectrometry. Anal. Bioanal. Chem. 389:1633-1638. - PubMed
Publication types
MeSH terms
Substances
LinkOut - more resources
Full Text Sources
Other Literature Sources

