. 2008 Dec;36(21):6795-805.
doi: 10.1093/nar/gkn752. Epub 2008 Oct 25.

Positional distribution of human transcription factor binding sites

Affiliations

Positional distribution of human transcription factor binding sites

Mark Koudritsky et al. Nucleic Acids Res. 2008 Dec.

Abstract

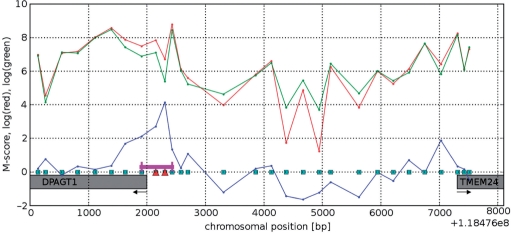
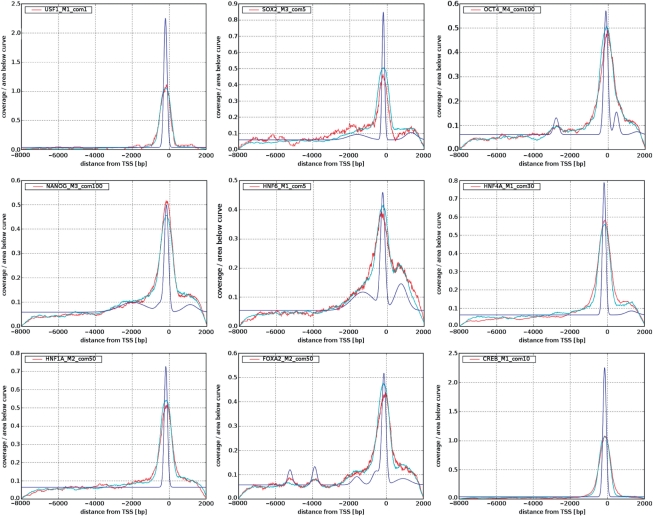
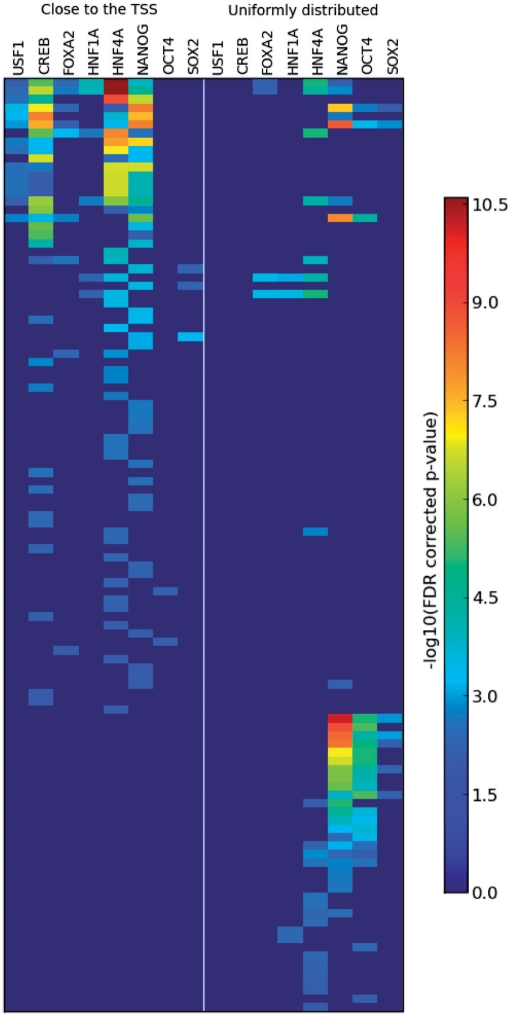
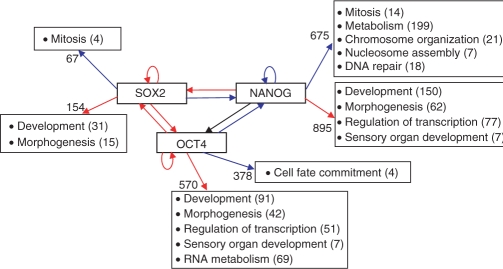
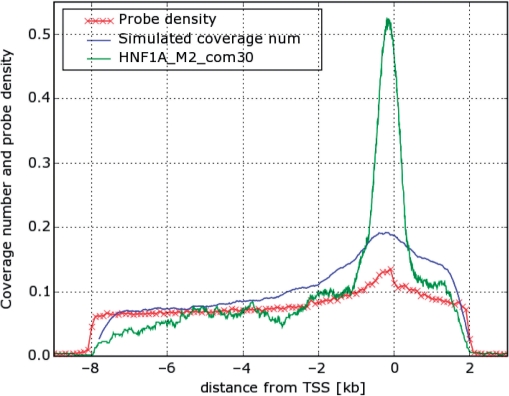
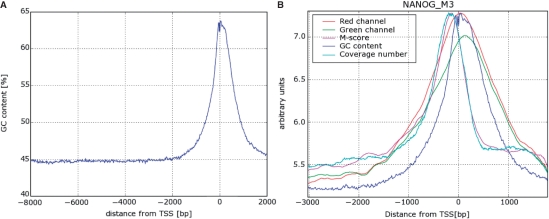
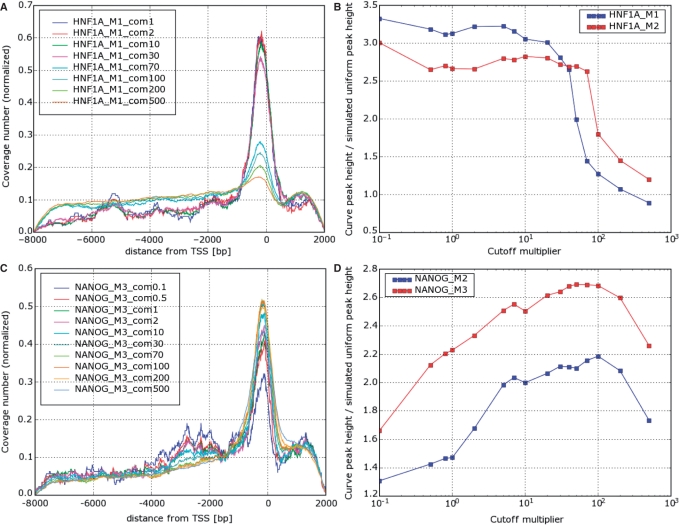
We developed a method for estimating the positional distribution of transcription factor (TF) binding sites using ChIP-chip data, and applied it to recently published experiments on binding sites of nine TFs: OCT4, SOX2, NANOG, HNF1A, HNF4A, HNF6, FOXA2, USF1 and CREB1. The data were obtained from a genome-wide coverage of promoter regions from 8-kb upstream of the transcription start site (TSS) to 2-kb downstream. The number of target genes of each TF ranges from few hundred to several thousand. We found that for each of the nine TFs the estimated binding site distribution is closely approximated by a mixture of two components: a narrow peak, localized within 300-bp upstream of the TSS, and a distribution of almost uniform density within the tested region. Using Gene Ontology (GO) and Enrichment analysis, we were able to associate (for each of the TFs studied) the target genes of both types of binding with known biological processes. Most GO terms were enriched either among the proximal targets or among those with a uniform distribution of binding sites. For example, the three stemness-related TFs have several hundred target genes that belong to 'development' and 'morphogenesis' whose binding sites belong to the uniform distribution.


Figures

Figure 1.
Figure 1.
Example of a promoter region between TSSs of two genes: DPAGT1 and TMEM24, on chromosome 11. Microarray probes are depicted as squares on the x axis, red and green curves show log intensity of the red (IP) and green (WCE) channels from NANOG data, the blue curve is the resulting M-score. Probes detected as bound are marked with red triangles. The resulting bound region is marked with a magenta line. Arrows indicate direction of transcription.
Figure 2.
Figure 2.
Illustration of the coverage number concept (not to scale). The red curve shows the coverage number of the hypothetical set of bound regions which are represented by magenta colored bars.
Figure 3.
Figure 3.
The fitted deconvolved binding site distributions (blue) and the corresponding simulated ones (cyan) compared with experimental (red) coverage number plots.
Figure 4.
Figure 4.
Enrichment scores of about 100 GO terms among the genes bound by the studied TFs. Red color represent high enrichment. Each row is a GO term. The TFs are listed twice; left panel present the scores of enrichment among genes with proximal binding, while the right panel with distal—uniformly distributed binding. Notice the two clearly distinct groups of GO terms: one is predominantly enriched among the genes with proximal binding (the upper left corner)—those are mostly metabolism-related GO terms and liver-related TFs. The other group (bottom right corner) contains mostly development-related GO terms enriched among genes with uniformly distributed binding sites of stem cell-related TFs. Also note that NANOG is present in both of these groups.
Figure 5.
Figure 5.
Schematic diagram of the stem cell circuit with some of the GO categories enriched among the genes bound by each TF. Blue arrows represent binding close to the TSS, red—distal, uniformly distributed. Black arrow means that binding is inferred from another source (15) and no information is available about the position. Numbers near the GO categories indicate the number of genes from the group in this category. Numbers on the arrows indicate the total number of genes in the group submitted to GO analysis (genes with multiple TSSs were omitted from this GO analysis). The information about the binding of OCT4 and SOX2 to the promoter of OCT4 was taken from Ref. (26) rather than from the ChIP-chip experiment since the microarray in the platform used does not cover properly the OCT4 promoter.
Figure 6.
Figure 6.
Comparison of coverage number plot for HNF1A with the coverage number plot obtained from a simulation that uses a uniform distribution of binding sites. All three curves were normalized to have the same area under the curve.
Figure 7.
Figure 7.
(A) GC content as a function of distance from TSS. Average over about 13 000 promoters, smoothed with a Gaussian kernel with σ = 6 nt. (B) This figure shows the difference between the locations of the peak of the GC content (same as A) and of the coverage number plot for NANOG averaged over all the promoters. Notice that the peaks of intensity of red and green channels coincide with the peak of GC content as expected. The peaks of coverage number and M-score, on the other hand, are more upstream the TSS providing convincing evidence that the sharp peaks in coverage number plots are not an artifact caused by GC-content variation. The different curves were shifted and scaled vertically for convenient comparison; therefore the vertical axis has no meaningful units. The curves for M-score and the red and green channel intensities were obtained by linear interpolation between individual probes which was then averaged over all the promoters represented on the chip.
Figure 8.
Figure 8.
(A) Coverage number plot and (B) peak height for HNF1A; the same for NANOG (C and D), for varying P-value cutoff multiplier (com). Note in (A) that for HNF1A the curve remains almost unchanged up to com70, while for NANOG it increases till com = 100 and diminishes again. The critical values of com, where the change of behavior occurs, depends on the TF and may vary also between replicate experiments of the same TF (B). The peak height plots are in units in which one is the height of the peak on a simulated coverage plot corresponding to a uniform distribution of binding sites.

References

    1. Allison DB, Cui X, Page GP, Sabripour M. Microarray data analysis: from disarray to consolidation and consensus. Nat. Rev. Genet. 2006;7:55–65. - PubMed
    1. Rodriguez BA, Huang TH. Tilling the chromatin landscape: emerging methods for the discovery and profiling of protein-DNA interactions. Biochem. Cell. Biol. 2005;83:525–534. - PubMed
    1. Hertzberg L, Zuk O, Getz G, Domany E. Finding motifs in promoter regions. J. Comput. Biol. 2005;12:314–330. - PubMed
    1. Kel AE, Gossling E, Reuter I, Cheremushkin E, Kel-Margoulis OV, Wigender E. MATCH: a tool for searching transcription factor binding sites in DNA sequences. Nucleic Acids Res. 2003;31:3576–3579. - PMC - PubMed
    1. Sharan R, Ben-Hur A, Loots GG. Ovcharenko ICREME: cis-regulatory module explorer for the human genome. Nucleic Acids Res. 2004;32:W253–W256. - PMC - PubMed

Publication types

Substances