. 2008;3(10):e3529.
doi: 10.1371/journal.pone.0003529. Epub 2008 Oct 27.

HPV16 E7-dependent transformation activates NHE1 through a PKA-RhoA-induced inhibition of p38alpha

Affiliations

HPV16 E7-dependent transformation activates NHE1 through a PKA-RhoA-induced inhibition of p38alpha

Rosa A Cardone et al. PLoS One. 2008.

Retraction in

Abstract

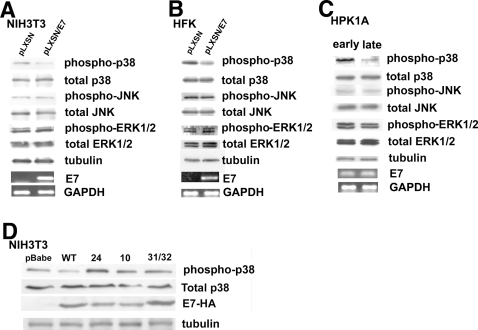
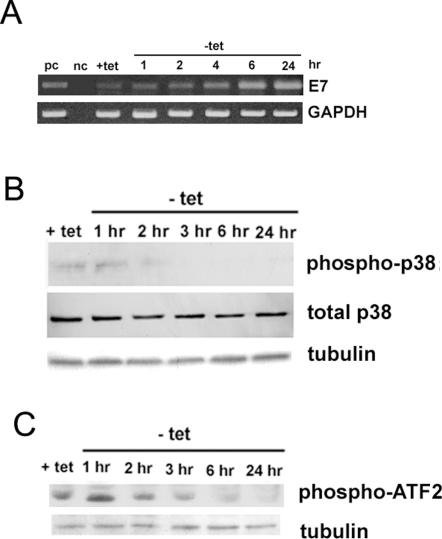
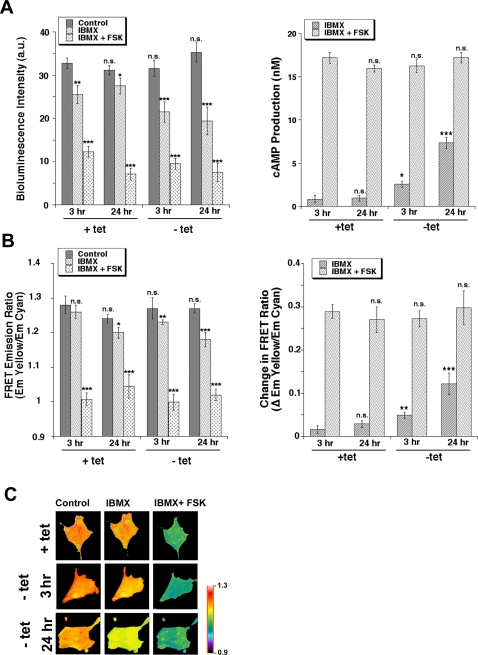
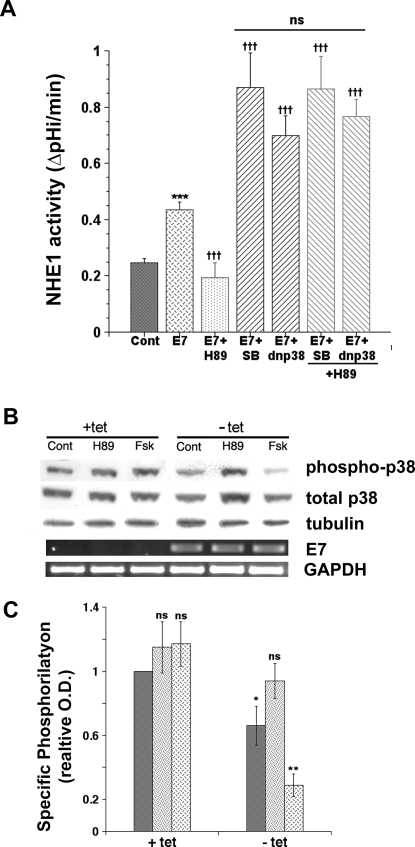
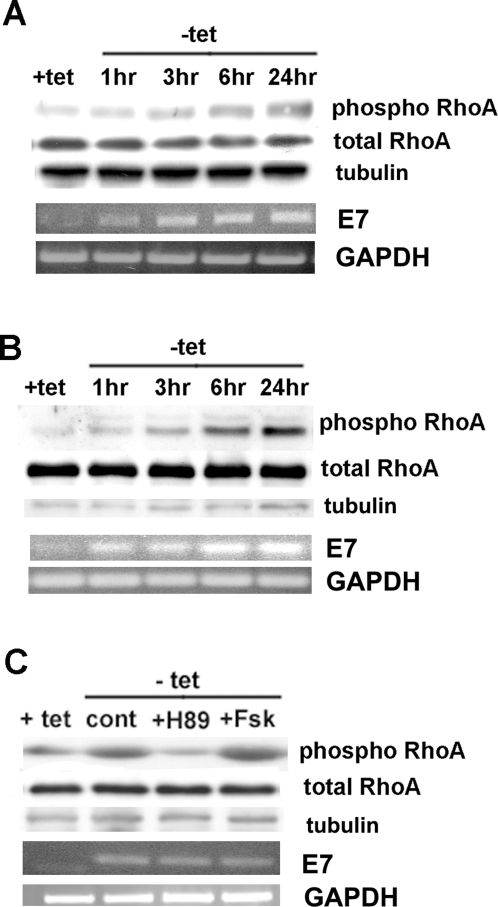
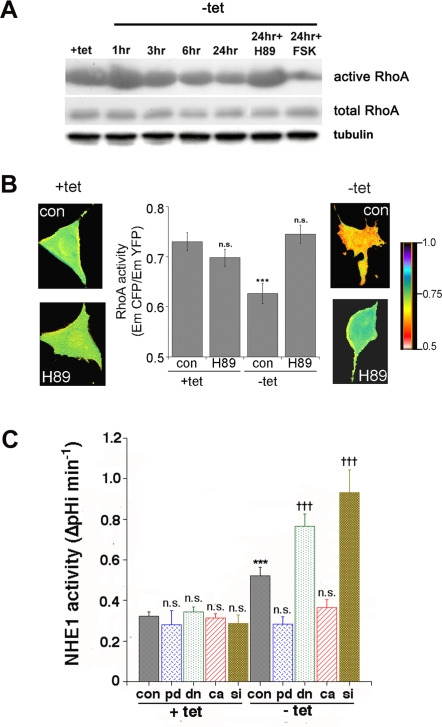
Background: Neoplastic transformation originates from a large number of different genetic alterations. Despite this genetic variability, a common phenotype to transformed cells is cellular alkalinization. We have previously shown in human keratinocytes and a cell line in which transformation can be turned on and followed by the inducible expression of the E7 oncogene of human papillomavirus type 16 (HPV16), that intracellular alkalinization is an early and essential physiological event driven by the up-regulation of the Na/(+)H(+) exchanger isoform 1 (NHE1) and is necessary for the development of other transformed phenotypes and the in vivo tumor formation in nude mice.

Methodology: Here, we utilize these model systems to elucidate the dynamic sequence of alterations of the upstream signal transduction systems leading to the transformation-dependent activation of NHE1.

Principal findings: We observe that a down-regulation of p38 MAPK activity is a fundamental step in the ability of the oncogene to transform the cell. Further, using pharmacological agents and transient transfections with dominant interfering, constitutively active, phosphorylation negative mutants and siRNA strategy to modify specific upstream signal transduction components that link HPV16 E7 oncogenic signals to up-regulation of the NHE1, we demonstrate that the stimulation of NHE1 activity is driven by an early rise in cellular cAMP resulting in the down-stream inhibition of p38 MAPK via the PKA-dependent phosphorylation of the small G-protein, RhoA, and its subsequent inhibition.

Conclusions: All together these data significantly improve our knowledge concerning the basic cellular alterations involved in oncogene-driven neoplastic transformation.


Conflict of interest statement

Competing Interests: The authors have declared that no competing interests exist.

Figures

Figure 1
Figure 1. Only HPV16 E7 expression and not other non-transforming HPV types decreases p38 MAPK phosphorylation in both NIH3T3 cells and human keratinocytes.
A. Cell extracts from empty pLXSN vector NIH3T3 cells and HPV16 E7 infected cells were analyzed by Western Blot for both the phosphorylation state and total expression level of ERK, JNK and p38 MAPK. Western blot analysis was carried out using polyclonal anti-phospho-ERK1/2, anti-phospho-JNK and anti-phospho-p38 antibodies followed by polyclonal anti-total ERK1/2, total-JNK and total-p38 MAP Kinase antibodies. Tubulin expression was used as an additional loading control and 500 ng of each sample total RNA were subjected to a semi-quantitative RT-PCR for HPV16 E7 expression analysis. GAPDH: loading control, pc: positive control, nc: negative control. B. Cell extracts from empty pLXSN vector HFK cells and HPV16 E7 infected HKF cells were analyzed by Western Blot for both the phosphorylation state and total expression level of ERK, JNK and p38 MAPK as above. C. Cell extracts from early passage (p94) HPK1A cells and late passage (p396) HPK1A cells were analyzed by Western Blot for both the phosphorylation state and total expression level of ERK, JNK and p38 MAPK as above. D. NIH3T3 cells were infected with recombinant retroviruses expressing either empty vector (pBabe), wild type HPV16 E7-Ha tag (WT), or transformation-deficient HPV16 E7-Ha mutants (24, 10, 31/32), and total cell extracts were assayed in Western blot for phosphorylated and total p38 expression levels as above. All the cell lines expressed E7 as confirmed by using an Ab anti HA-tag (E7-HA). Preliminary experiments demonstrated that the HA tag does not interfer with the induction of transformation (data not shown).
Figure 2
Figure 2. Time course of changes in HPV16 E7 expression and both phosphorylation and activity of p38 MAPK in 2BN11 cells after tetracycline (tet) removal.
A. The activation of HPV16 E7 transcription upon tet removal from the culture medium was determined by RT-PCR as described in in Materials and Methods. After tet removal the cells were collected at the indicated times, total RNA prepared, cDNA generated and the levels of message were determined. The levels of GAPDH were also determined in each sample as internal control. nc: negative control in which the PCR was performed in the absence of a template; pc: positive control included HPV16 E7 cDNA as template. B. Time course of HPV16 E7 expression-dependent inhibition of p38 phosphorylation, total p38 and tubulin in 2BN11 cells after tetracycline removal. C. p38 activity during HPV16 E7 expression (tet removal) was determined by exposing p38 immunoprecipitated from 1 mg of cell lysate to 10 µg GST-ATF-2 as described in methods. The amount of ATF-2 phosphorylated by p38 was analyzed by Western Blotting with an Phospho-ATF-2 (Thr71) antibody and tubulin levels in the homogenate was used as loading control.
Figure 3
Figure 3. HPV16 E7 expression stimulates cAMP generation in 2BN11 cells.
To determine the effect of E7 expression on cAMP production, cAMP levels were measured using A. the biochemical luciferase-based Kinase-Glo System where luminescence is inversely proportional to cAMP levels (for details see Methods). Cells were cultured with or without tet for either 3 or 24 hr and then either not treated (dark bars) or treated for 30 min with either 100 µM IBMX (light bars) or 100 µM IBMX plus 20 µM FSK (stippled bars). Left panel shows levels of luminescence in the various treatments while right panel shows the calculated increase in cAMP concentration with each treatment. Error bars represent the standard error of the mean (SEM) of three independent experiments. B. Time-lapse FRET imaging in live cells transfected with a PKA-based FRET probe, in which cyan and yellow mutants of GFP have been fused to its regulatory and catalytic subunits, respectively, so that cAMP-induced dissociation between the two is detected as FRET changes. Cells were transfected with the FRET cAMP biosensor for 24 hrs and then cultured with or without tet for either 3 or 24 hr. Cells were mounted in a perfusion chamber and the FRET ratio measured during superfusion with ringer alone followed by superfusion first with 100 µM IBMX and then 100 µM IBMX plus 20 µM FSK. Cells were imaged for CFP and YFP every 20 s and the YFP/CFP emission ratios (FRET ratios) obtained. Left panel shows levels of YFP/CFP emission ratios in the various treatments while right panel shows the calculated increase in YFP/CFP emission ratios with each treatment which is relative to increases in cAMP production. Data are the mean±SEM from 32 different cells. C. Pseudocolor images representing YFP/CFP emission ratios recorded under control conditions (plus and minus tet for either 3 or 24 hrs), after exposure to 100 µM IBMX and after stimulation with IBMX (100 µM) plus FSK (20 µM). Each image was scaled according to its high and low values at each time point to show relative level of cAMP at each time point. The dynamic range was 0.9–1.3. Warmer colors correspond to lower cAMP levels.
Figure 4
Figure 4. PKA is up-stream of p38 in regulating the HPV16 E7 expression-dependent stimulation of NHE1 activity.
A. HPV16 E7 expression was induced by removing tetracycline from the culture medium for 24 hrs and the consequences on NHE1 activity of the specific inhibition for 24 hrs of PKA by 10−7 M of its specific inhibitor, H89, and/or p38 by either 10−9 M of its specific pharmacological inhibitor, SB203580, or by the transient expression of a dominant negative (dn) mutant for p38alpha (p38AF, 3 µg) was determined by spectrofluorometry using the pH sensitive probe BCECF-AM. Confluent monolayers were loaded with BCECF and placed in the perfusion cuvette and the monolayer perfused with 135 mM Na+ nominally bicarbonate free-HEPES ringer (pH 7.4) plus (Cont) or minus (E7) 2 µM tetracycline as previously described . To analyze if PKA and p38 interact one each other in regulating NHE1 activity, cells were either first transfected with dnp38 for 48 hrs and then treated with H89 for 24 hrs or were simultaneosly treated with SB plus H89 for 24 hrs and NHE1 activity determined as above. Bars are mean±S.E. and the number of experiments ranged from 5 to 8. B. Non transformed (+tet) and transformed (−tet) cells were not treated (Cont) or treated with either 10−7 M H89 or 10−5 M FSK for 24 hrs and cells were homogenized as described in Materials and Methods. Aliquots containing 50 µg of protein were subjected to 10% SDS-PAGE and total and phosphorylated p38 was determined in Western Blot as in Figure 1. A representative immunoblot is shown. C. Summarized data of densitometrical analyses of p38 phosphorylation is represented as the relative ratio of the density of phospho-p38 against that of total p38. Relative ratio in control, non transformed cells was expressed as 1 arbitrary unit. Control cells are represented by dark bars, H89 treated cells by stippled bars and Fsk treated cells by cross-hatched bars. The data shown are mean values±S.E. (n = 4). p<0.05 (*) and p<0.01 (**) when compared with the control value by Student's t test.
Figure 5
Figure 5. HPV16 E7 induces PKA-dependent phosphorylation of RhoA.
A. Western Blotting analysis of the phosphorylation state of RhoA at different times after tet removal (+tet, 1 hr, 3 hr, 6 hr and 24 hr) with antibodies specific for phosphorylated Ser-188 of RhoA (phospho RhoA) followed by polyclonal anti-RhoA antibody (total RhoA). B. Co-immunoprecipitation with anti-phosphoserine antibody followed by anti-RhoA Western Blotting (phospho RhoA) at different times of HPV16 E7 expression (t0, 1 hr, 3 hr, 6 hr, 24 hr). Expression of total RhoA in cell lysates was analyzed by immunoblot analysis using the polyclonal anti-RhoA antibody. C. To test if RhoA-phosphorylation induced by HPV16 E7 expression was dependent on PKA, tetracycline was removed and the cells either not treated or treated with either the pharmacological PKA inhibitor (H89, 100 nM) or activator (forskolin, 10 µM) and RhoA phosphorylation was measured as above (A).
Figure 6
Figure 6. HPV16 E7 expression activates NHE1 via a PKA-mediated-reduction in RhoA activity.
A. Representative Western Blot of three GST-RBD pull-downs showing RhoA activity in 2BN11 cells at different times after tet removal and treated with 100 nM H89 and 10 µM FSK for the indicated times. The lower gel shows the amount of total RhoA in cell lysates. B. Sensitized FRET measurements of 2BN11 cells to determine the effect of E7 expression on RhoA activity in live cells. Cells were transfected with the RhoA biosensor pRaichu-1297× and then cultured with or without tet for 24 hr and treated or not with 100 nM H89 during the 24 hr period. Cells were imaged for CFP and FRET and the relative decreases in CFP/FRET ratios obtained (presented in the central column) indicate a decrease in active RhoA. Data are the mean±SEM from 32 to 37 different cells. ***P<0.005. CFP/FRET ratio images are in pseudocolor, with the color indicating the relative value at each pixel (lateral images), such that blue indicates the highest EmCFP/EmYFP ratio (highest RhoA activity), and red reflects the lowest EmCFP/EmYFP ratio (lowest RhoA activity). Scale bar is 10 µm. C. Role of PKA-mediated RhoA signalling on HPV16 E7-induced up-regulation of NHE1 activity. 2BN11 cells were transfected transiently with cDNA for either a phosphorylation dead (pd) RhoA mutant (blue cross-hatched bars), with dominant negative RhoA (dn) mutant (green stippled bars), with constitutively active RhoA (ca) (red striped bars) mutant or with siRNA against RhoA (brown reverse stippled bars). Control cells were transfected with the empty plasmid or non-specific siRNA transfected cells (scrambled) served as the control for RhoA silencing. After 24 hrs for cDNA construct or 48 hrs for siRNA transfection, tetracycline was then removed (−tet) or not (+tet) for a further 24 hrs and NHE1 activity was measured as described in Materials and Methods. Expression of these constructs had no effect on basal NHE1 activity in control, +tet cells. Inactivation of RhoA with the dn mutant and siRNA significantly potentiated the E7-induced stimulation of NHE1 activity while both activation of RhoA with the ca mutant and the block of RhoA phosphorylation by PKA with the pd mutant abrogated the E7-induced stimulation of NHE1 activity. Efficiency of siRNA-mediated RhoA knock-down was analyzed with immunofluorescence assay by using a monoclonal anti-RhoA antibody (green) and the blue fluorescent dye DAPI for staining nuclei (Figure S2).

References

    1. Hanahan D, Weinberg RA. The hallmarks of cancer. Cell. 2000;100(1):57–70. - PubMed
    1. Harguindey S, Orive G, Luis Pedraz J, Paradiso A, Reshkin SJ. The role of pH dynamics and the Na+/H+ antiporter in the etiopathogenesis and treatment of cancer. Two faces of the same coin–one single nature. Biochim Biophys Acta. 2005;1756(1):1–24. - PubMed
    1. Fang JS, Gillies RD, Gatenby RA. Adaptation to hypoxia and acidosis in carcinogenesis and tumor progression. Semin Cancer Biol. 2008;18(5):330–337. - PMC - PubMed
    1. Khavari TA, Rinn J. Ras/Erk MAPK signaling in epidermal homeostasis and neoplasia. Cell Cycle. 2007;6(23):2928–2931. - PubMed
    1. Cuevas BD, Abell AN, Johnson GL. Role of mitogen-activated protein kinase kinase kinases in signal integration. Oncogene. 2007;26(22):3159–3171. - PubMed

Publication types

MeSH terms

Substances