. 2009 Feb;193(1):69-83.
doi: 10.1007/s00221-008-1596-1. Epub 2008 Oct 25.

Variability in motor learning: relocating, channeling and reducing noise

Affiliations

Variability in motor learning: relocating, channeling and reducing noise

R G Cohen et al. Exp Brain Res. 2009 Feb.

Abstract

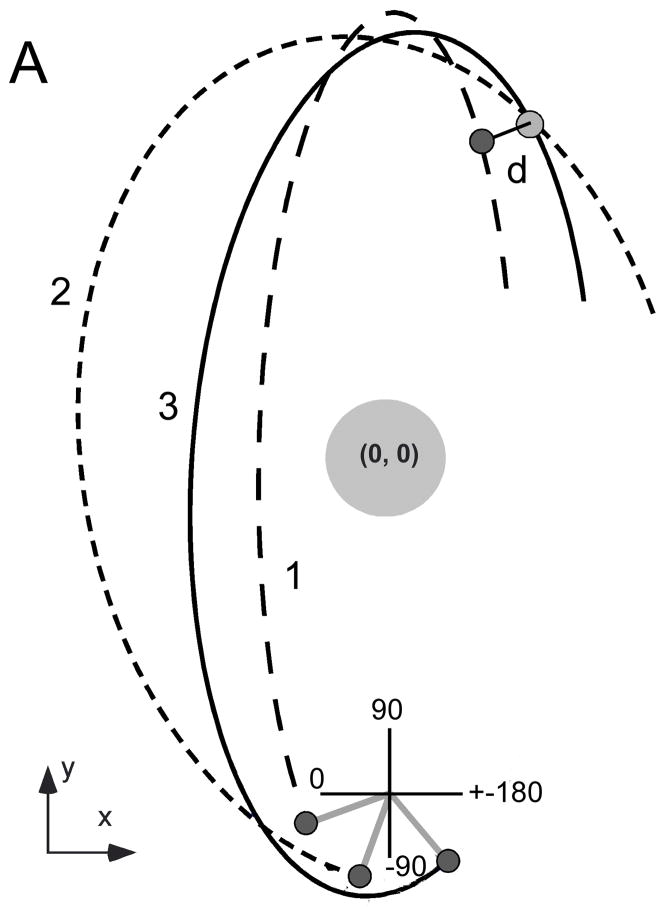
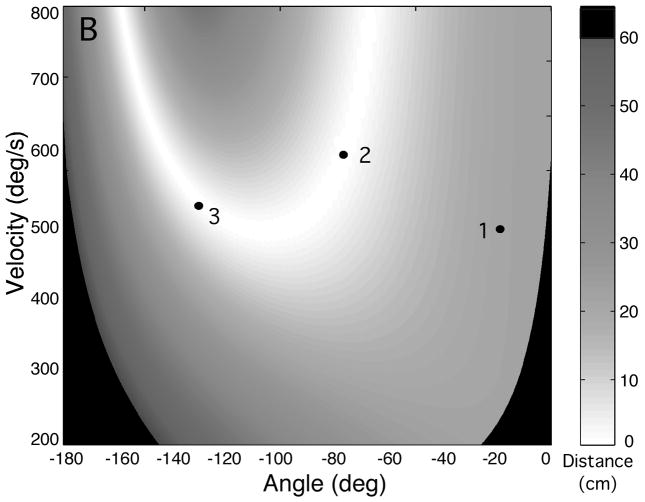
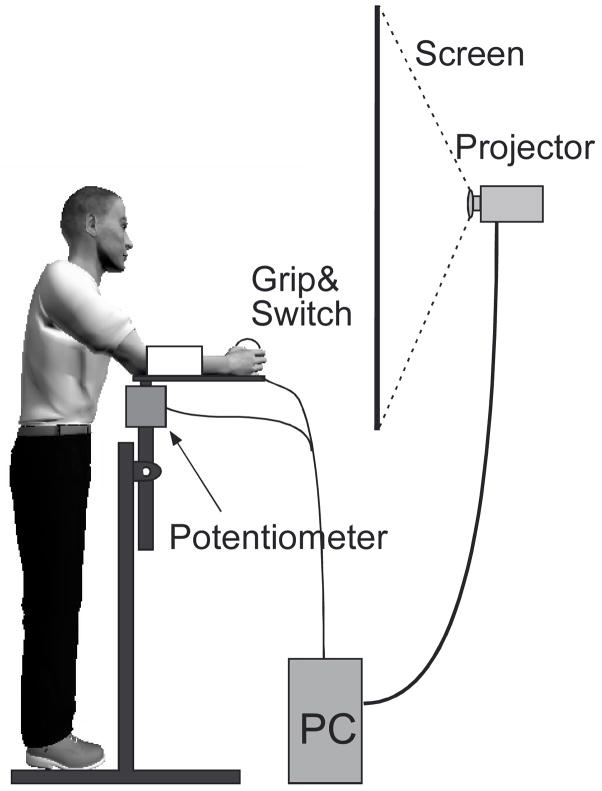
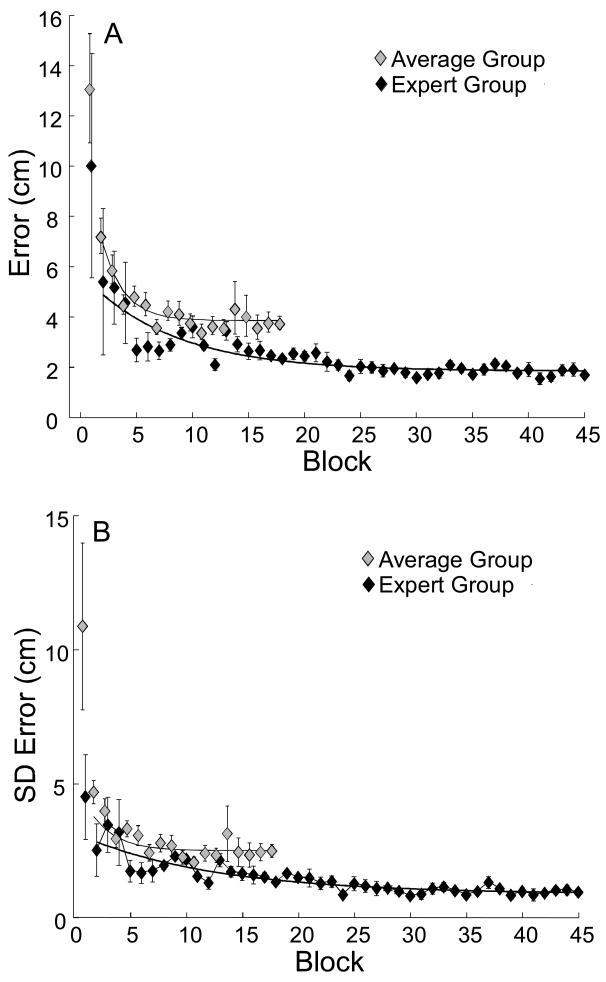
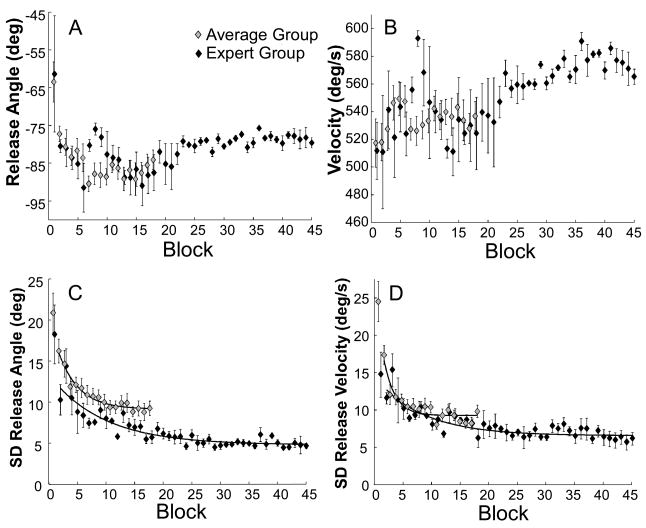
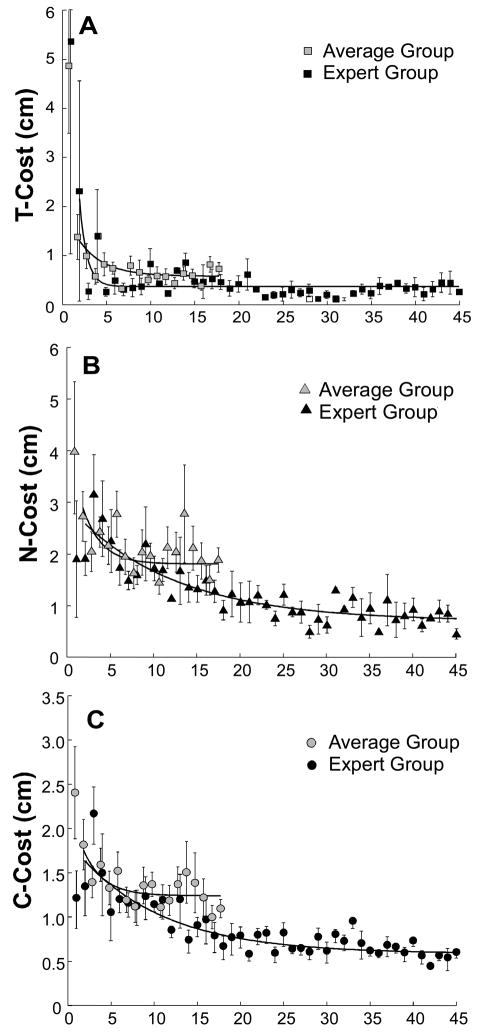
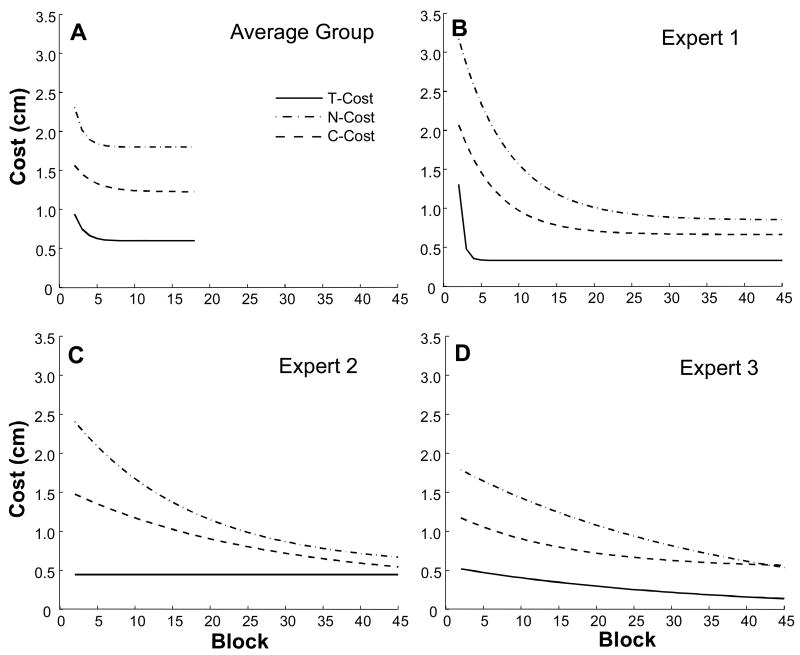
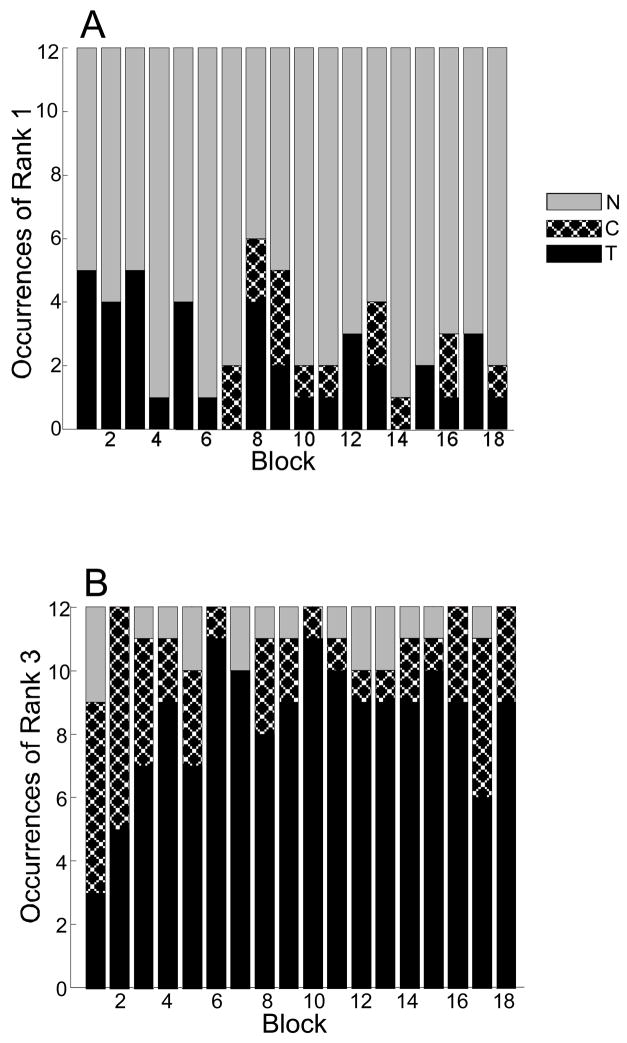
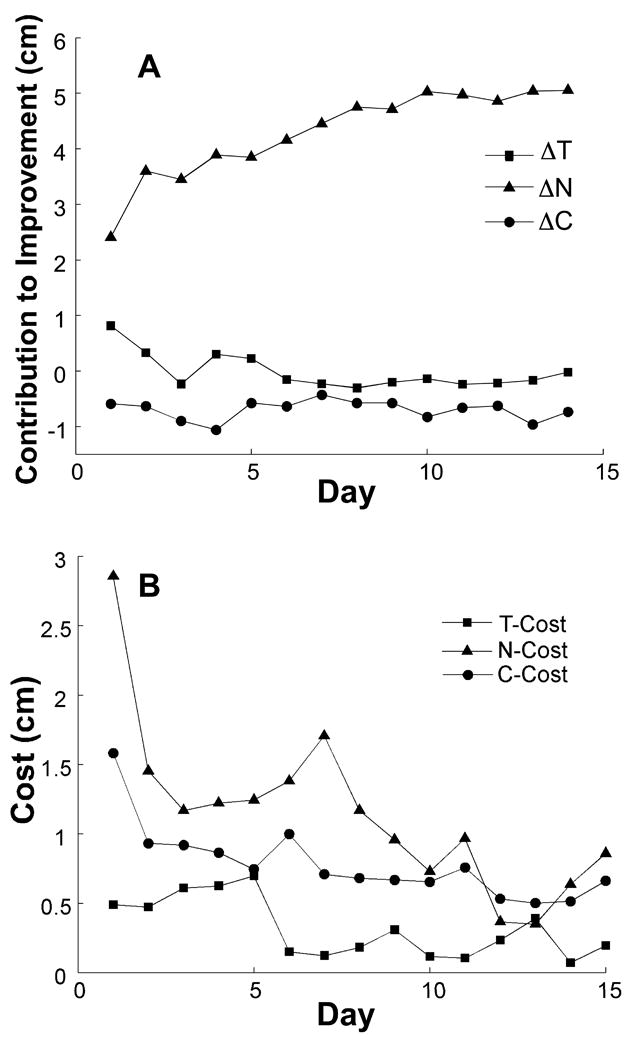
Variability in motor performance decreases with practice but is never entirely eliminated, due in part to inherent motor noise. The present study develops a method that quantifies how performers can shape their performance to minimize the effects of motor noise on the result of the movement. Adopting a statistical approach on sets of data, the method quantifies three components of variability (tolerance, noise, and covariation) as costs with respect to optimal performance. T-Cost quantifies how much the result could be improved if the location of the data were optimal, N-Cost compares actual results to results with optimal dispersion at the same location, and C-Cost represents how much improvement stands to be gained if the data covaried optimally. The TNC-Cost analysis is applied to examine the learning of a throwing task that participants practiced for 6 or 15 days. Using a virtual set-up, 15 participants threw a pendular projectile in a simulated concentric force field to hit a target. Two variables, angle and velocity at release, fully determined the projectile's trajectory and thereby the accuracy of the throw. The task is redundant and the successful solutions define a nonlinear manifold. Analysis of experimental results indicated that all three components were present and that all three decreased across practice. Changes in T-Cost were considerable at the beginning of practice; C-Cost and N-Cost diminished more slowly, with N-Cost remaining the highest. These results showed that performance variability can be reduced by three routes: by tuning tolerance, covariation and noise in execution. We speculate that by exploiting T-Cost and C-Cost, participants minimize the effects of inevitable intrinsic noise.


Figures

Figure 1
Figure 1
Work space and execution space for three hypothetical throws. A: Three exemplary throws in work space as participants see in the experiment. The view is a top-down view onto the pendular skittles task. B: The release variables of the same three throws represented in execution space. The grey shades indicate the level of success for different combinations of release angle and velocity. White denotes the set of release angles and velocities that lead to a direct hit, the solution manifold. A perfect hit is defined as the center of the ball passing within 1.3 cm of the center of the target.
Figure 1
Figure 1
Work space and execution space for three hypothetical throws. A: Three exemplary throws in work space as participants see in the experiment. The view is a top-down view onto the pendular skittles task. B: The release variables of the same three throws represented in execution space. The grey shades indicate the level of success for different combinations of release angle and velocity. White denotes the set of release angles and velocities that lead to a direct hit, the solution manifold. A perfect hit is defined as the center of the ball passing within 1.3 cm of the center of the target.
Figure 2
Figure 2
Experimental setup.
Figure 3
Figure 3
Exemplary data sets and the corresponding virtual data sets used for the analysis of T-Cost, C-Cost, and N-Cost. Exemplary data from one participant are shown from three blocks. Circles represent actual throws made by the participant, and diamonds represent surrogate data with one component idealized. The panels in the top row show data from the first block of practice on the Day 1; the middle row shows data from the first block of practice on the Day 6, and the bottom row shows data from the first block of practice on Day 15. The left column shows data optimized in terms of tolerance; the middle column shows data optimized in terms of covariation, and the right column shows data optimized in terms of noise. For more detail see text.
Figure 4
Figure 4
Changes in the error to the target with practice. For each block the data of 60 trials were averaged. Participants performed three blocks of trials per day. A: Mean error for each block of throws. Mean results for twelve participants over eighteen blocks (six days) of practice are shown in gray, and results for the expert participants over 45 blocks (15 days) of practice are shown in black. Error bars show standard error across participants. B: Standard deviations of error averaged over participants across blocks of trials. Error bars show standard error across participants.
Figure 5
Figure 5
Changes of the two execution variables, angle and velocity at release, across blocks of practice. The gray symbols represent averages across 12 participants with the error bars denoting the standard error across participants. The black symbols denote the expert participants who practiced for 45 blocks (15 days). A: Average release angle. B: Average release velocity. C: Standard deviations of release angle. D: Standard deviations of release velocity.
Figure 6
Figure 6
Contributions of T-Cost, N-Cost and C-Cost to error. Mean results for twelve participants over 18 blocks (six days) of practice are shown as in gray, and results for the expert group over 45 blocks (15 days) of practice are shown in black. Error bars show standard error across participants.
Figure 7
Figure 7
Exponential fits to T-Cost, N-Cost, and C-Cost for the average and the expert group data. A: Exponential fits to the three costs for the group. B, C, D: Exponential fits for the three expert participants.
Figure 8
Figure 8
Summary of rank orders of the three costs across blocks and participants. A: Number of participants across practice blocks for whom each cost made the greatest contribution to error. B: Number of participants across blocks for whom each cost made the smallest contribution to error.
Figure 9
Figure 9
Results of the TNC-analyses applying the ΔTNC calculations (panel A) and the TNC-Cost calculations (panel B).

References

    1. Beek PJ, van Santvoord AAM. Learning the cascade juggle: A dynamical systems analysis. Journal of Motor Behavior. 1992;24(1):85–94. - PubMed
    1. Bernstein N. The coordination and regulation of movement. London: Pergamon Press; 1967.
    1. Bernstein N. Dexterity and its development. In: Latash ML, Turvey MT, editors. Dexterity and its development. Champaign: Human Kinetics; 1996.
    1. Burton RM, Mpitsos GJ. Event-dependent control of noise enhances learning in neural networks. Neural Networks. 1992;5:627–637.
    1. Churchland MM, Afshar A, Shenoy KV. A central source of movement variability. Neuron. 2006;52:1085–1096. - PMC - PubMed

Publication types

LinkOut - more resources