

Choice as a function of reinforcer "hold": from probability learning to concurrent reinforcement
- PMID: 18954229
- PMCID: PMC2673116
- DOI: 10.1037/0097-7403.34.4.437
Choice as a function of reinforcer "hold": from probability learning to concurrent reinforcement
Abstract
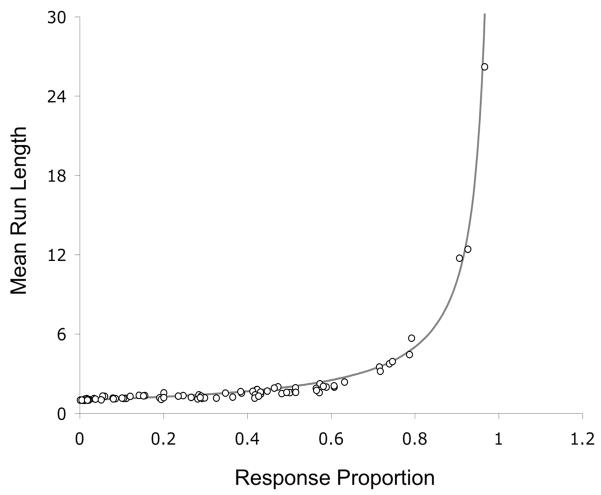
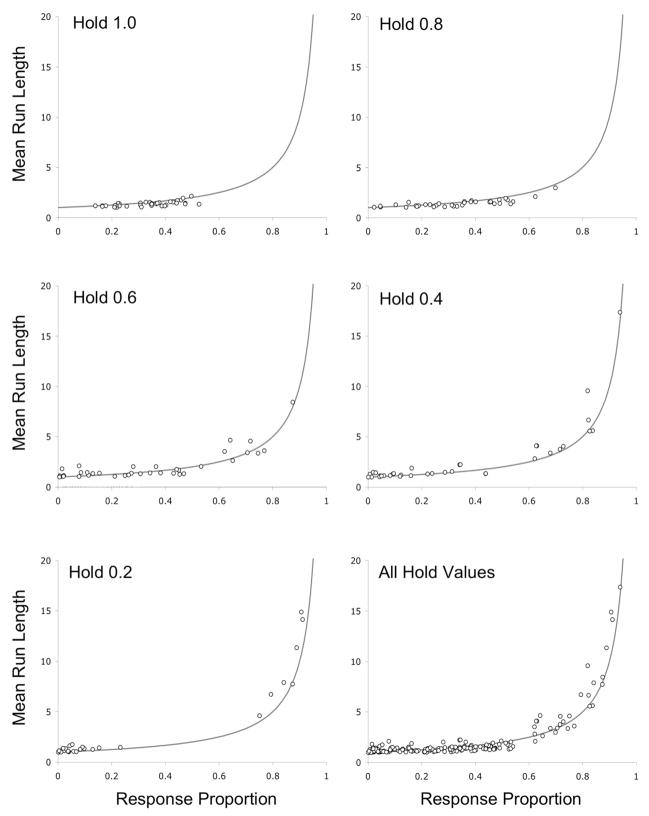
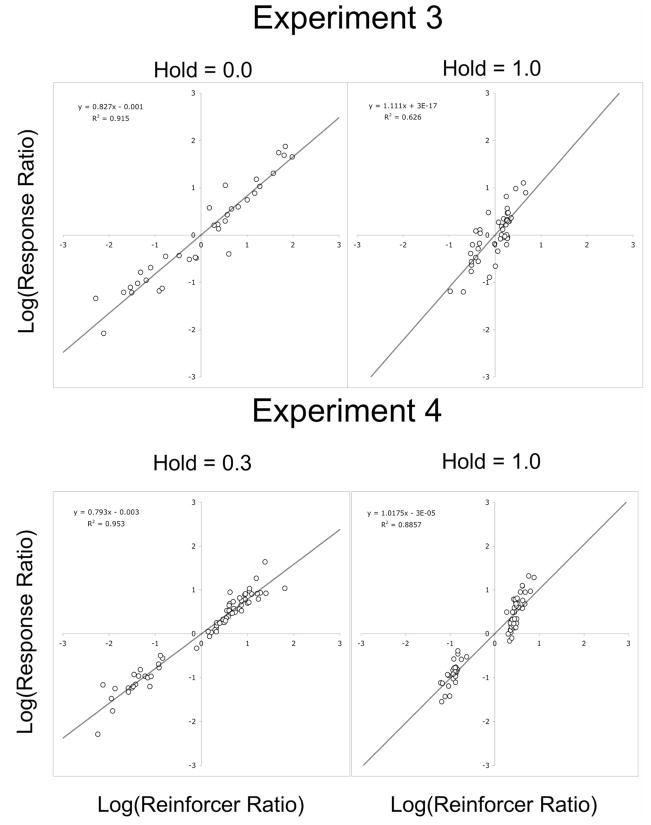
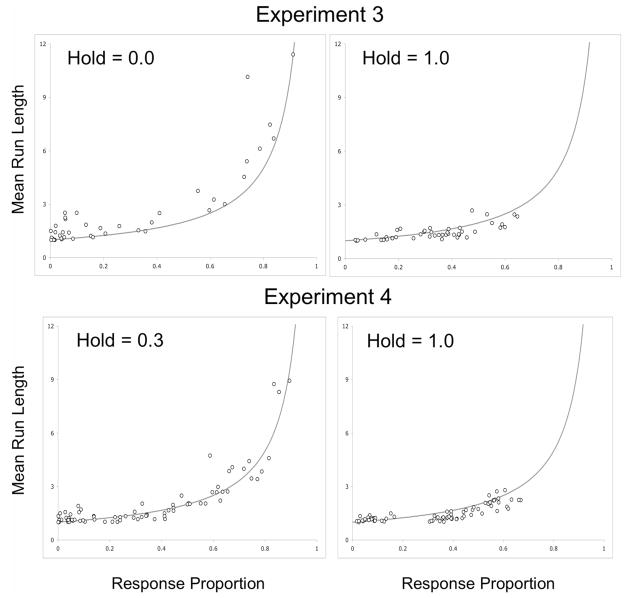
Two procedures commonly used to study choice are concurrent reinforcement and probability learning. Under concurrent-reinforcement procedures, once a reinforcer is scheduled, it remains available indefinitely until collected. Therefore reinforcement becomes increasingly likely with passage of time or responses on other operanda. Under probability learning, reinforcer probabilities are constant and independent of passage of time or responses. Therefore a particular reinforcer is gained or not, on the basis of a single response, and potential reinforcers are not retained, as when betting at a roulette wheel. In the "real" world, continued availability of reinforcers often lies between these two extremes, with potential reinforcers being lost owing to competition, maturation, decay, and random scatter. The authors parametrically manipulated the likelihood of continued reinforcer availability, defined as hold, and examined the effects on pigeons' choices. Choices varied as power functions of obtained reinforcers under all values of hold. Stochastic models provided generally good descriptions of choice emissions with deviations from stochasticity systematically related to hold. Thus, a single set of principles accounted for choices across hold values that represent a wide range of real-world conditions.
(c) 2008 APA, all rights reserved.
Figures


Similar articles
-
Barycentric extension of generalized matching.J Exp Anal Behav. 2009 Sep;92(2):139-59. doi: 10.1901/jeab.2009.92-139. J Exp Anal Behav. 2009. PMID: 20354596 Free PMC article.
-
Examining the discriminative and strengthening effects of reinforcers in concurrent schedules.J Exp Anal Behav. 2011 Sep;96(2):227-41. doi: 10.1901/jeab.2011.96-227. J Exp Anal Behav. 2011. PMID: 21909166 Free PMC article.
-
Local preference in concurrent schedules: the effects of reinforcer sequences.J Exp Anal Behav. 2005 Jul;84(1):37-64. doi: 10.1901/jeab.2005.114-04. J Exp Anal Behav. 2005. PMID: 16156136 Free PMC article.
-
A model for discriminating reinforcers in time and space.Behav Processes. 2016 Jun;127:62-73. doi: 10.1016/j.beproc.2016.03.010. Epub 2016 Mar 22. Behav Processes. 2016. PMID: 27016156 Review.
-
Acquisition of choice in concurrent chains: Assessing the cumulative decision model.Behav Processes. 2016 May;126:82-93. doi: 10.1016/j.beproc.2016.03.011. Epub 2016 Mar 19. Behav Processes. 2016. PMID: 27005579 Review.
Cited by
-
Barycentric extension of generalized matching.J Exp Anal Behav. 2009 Sep;92(2):139-59. doi: 10.1901/jeab.2009.92-139. J Exp Anal Behav. 2009. PMID: 20354596 Free PMC article.
-
Information: theory, brain, and behavior.J Exp Anal Behav. 2013 Nov;100(3):408-31. doi: 10.1002/jeab.49. Epub 2013 Oct 4. J Exp Anal Behav. 2013. PMID: 24122456 Free PMC article.
-
Dynamics of pre- and post-choice behaviour: rats approximate optimal strategy in a discrete-trial decision task.Proc Biol Sci. 2015 Mar 22;282(1803):20142963. doi: 10.1098/rspb.2014.2963. Proc Biol Sci. 2015. PMID: 25694623 Free PMC article.
-
Reinforcement and induction of operant variability.Behav Anal. 2012 Fall;35(2):229-35. doi: 10.1007/BF03392281. Behav Anal. 2012. PMID: 23450914 Free PMC article. No abstract available.
-
The active time model of concurrent choice.PLoS One. 2024 May 21;19(5):e0301173. doi: 10.1371/journal.pone.0301173. eCollection 2024. PLoS One. 2024. PMID: 38771859 Free PMC article.
References
-
- Aparicio CF, Cabrera F. Choice with multiple alternatives: The barrier choice paradigm. Mexican Journal of Behavior Analysis. 2001;27:97–118.
