. 2008 Oct 27:9:505.
doi: 10.1186/1471-2164-9-505.

RAId_DbS: mass-spectrometry based peptide identification web server with knowledge integration

Affiliations

RAId_DbS: mass-spectrometry based peptide identification web server with knowledge integration

Gelio Alves et al. BMC Genomics. .

Abstract

Background: Existing scientific literature is a rich source of biological information such as disease markers. Integration of this information with data analysis may help researchers to identify possible controversies and to form useful hypotheses for further validations. In the context of proteomics studies, individualized proteomics era may be approached through consideration of amino acid substitutions/modifications as well as information from disease studies. Integration of such information with peptide searches facilitates speedy, dynamic information retrieval that may significantly benefit clinical laboratory studies.

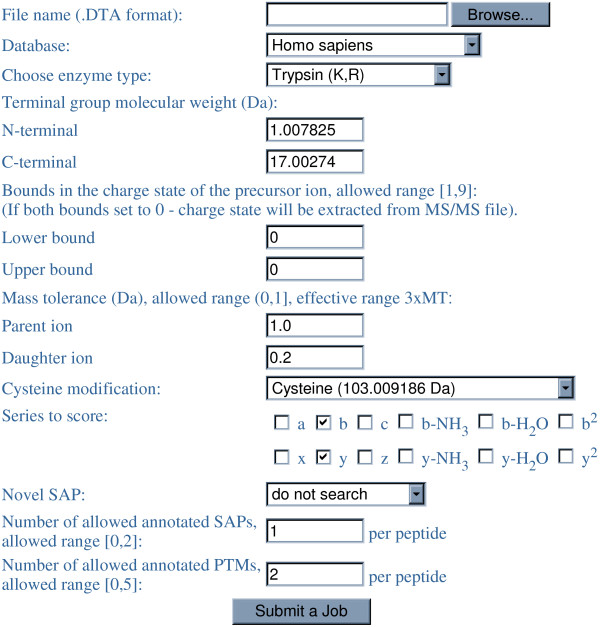
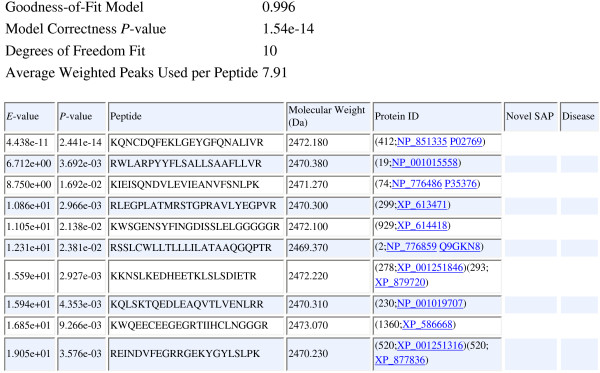
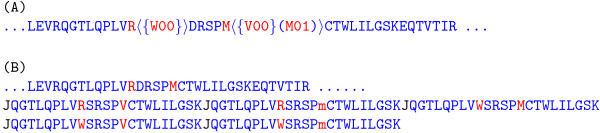
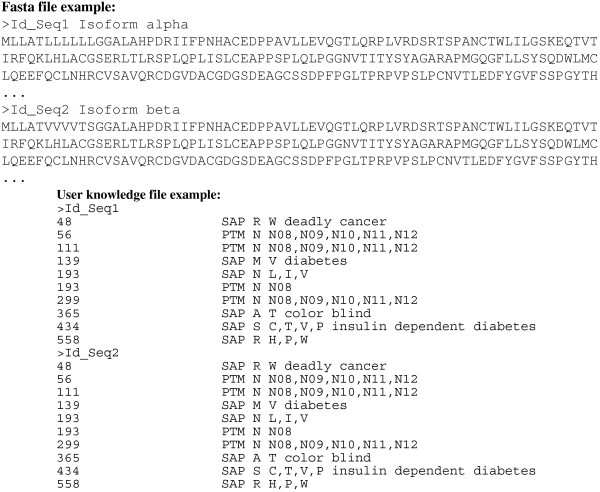
Description: We have integrated from various sources annotated single amino acid polymorphisms, post-translational modifications, and their documented disease associations (if they exist) into one enhanced database per organism. We have also augmented our peptide identification software RAId_DbS to take into account this information while analyzing a tandem mass spectrum. In principle, one may choose to respect or ignore the correlation of amino acid polymorphisms/modifications within each protein. The former leads to targeted searches and avoids scoring of unnecessary polymorphism/modification combinations; the latter explores possible polymorphisms in a controlled fashion. To facilitate new discoveries, RAId_DbS also allows users to conduct searches permitting novel polymorphisms as well as to search a knowledge database created by the users.

Conclusion: We have finished constructing enhanced databases for 17 organisms. The web link to RAId_DbS and the enhanced databases is http://www.ncbi.nlm.nih.gov/CBBResearch/qmbp/RAId_DbS/index.html. The relevant databases and binaries of RAId_DbS for Linux, Windows, and Mac OS X are available for download from the same web page.


Figures

Figure 1
Figure 1
Information-preserved protein clustering example. Once a consensus sequence is selected, members of a cluster are merged into the consensus one-by-one. This figure illustrates how the information of a member sequence is merged into the consensus sequence. Amino acid followed by two zeros indicates an annotated SAP. Every annotated PTM has a two-digit positive integer that is used to distinguish different modifications. The difference in the primary sequences between a member and the consensus introduces cluster-induced SAPs. In this example, the residues Q and A (in red) in the consensus are different from the residues K and V (in blue) in the member sequence. As a consequence, K becomes a cluster-induced SAP associated with Q and V becomes a cluster-induced SAP associated with A. The annotated SAP, ⟨{W00}⟩, associated with residue R in the member sequence is merged into the consensus sequence, see the updated consensus sequence in the figure. Note that the annotated PTM, ⟨(N11)⟩, associated with N in the member sequence is merged with a different annotated PTM, ⟨(N08)⟩, at the same site of the consensus sequence. In this figure, all the merged information from the member sequence are shown in blue color to indicate that during the searches we can choose to respect the correlated information from each member sequence separately. To respect the correlated information means that when scoring the peptide segment LQ ⟨{K00}⟩ RLVA ⟨{V00}⟩ DR of the consensus sequence RAId_DbS only considers the combinations L(red Q)RLV(red A)DR and L(blue K)RLV(blue V)DR, but not L(red Q)RLV(blue V)DR and L(blue K)RLV(red A)DR. Having the choice to distinguish the SAPs/PTMs originated from individual member sequences, RAId_DbS can target on documented SAP/PTM combinations associated with certain disease (if it exists) and can avoid scoring unnecessary SAP/PTM combinations when there are several variable sites occurring within a peptide. However, currently we find almost no incidence of multiple variable sites within a short peptide in all our databases constructed. Therefore, the feature of respecting correlated information is only implemented in our in-house version, not yet in the web version. Furthermore, not forcing the integrity of correlated information also allows for novel SAP discovery in a controlled fashion, meaning that one is looking for SAPs with local precedence. Finally, let us emphasize that although the SAPs, PTMs are merged each annotation's origin and disease associations are kept in the processed definition file, allowing for faithful information retrieval at the final reporting stage of the RAId_DbS program.
Figure 2
Figure 2
RAId_DbS web interface. The link to this webpage is . Enhanced databases for different organisms can be selected in the dropdown list.
Figure 3
Figure 3
The Format of Search Results Reported by RAId_DbS. The report format of RAId_DbS contains a header portion that shows important relevant information pertinent to the score statistics. The Goodness-of-fit of the score model is reported. Basically, it represents how well the score model, be theoretically derived or assumed, agrees with the cumulated score histogram. Also reported is a quantity called the model P-value, which documents the likelihood for the correlation strength between the model score distribution and the score histogram to come out of random matching. In the report table, the first column shows the E-values and the second column shows the P-values. The protein IDs, shown in fifth column, also serves as the links to the proteins containing the reported peptide. The sixth column contains information of novel SAPs, if the reported peptide contains a novel SAP. The seventh column shows disease information, if the reported peptide contains disease related SAPs or PTMs.
Figure 4
Figure 4
Structure of Enhanced Database. Consensus protein sequences NP_775259 (first line, residues 480 – 510 shown) and NP_076410 (second and third lines, residues 81 – 170 shown) are used as examples to demonstrate the structure of our sequence file, part of the enhanced database. A "[" character is always inserted after the last amino acid of each protein to serve as a separator. Annotated SAPs and PTMs associated with an amino acid are included in a pair of angular brackets following that amino acid. SAPs are further enclosed by a pair of curly brackets while PTMs are further enclosed by a pair of round brackets. Amino acid followed by two zeros indicates an annotated SAP. Every annotated PTM has a two-digit positive integer that is used to distinguish different modifications.
Figure 5
Figure 5
Illustration of Minimum Redundancy of our Database. In this example, the sequence has two nearby variable sites with residues R and M colored in red. Residue R may be replaced by a residue W due to a possible SAP; while residue M may be replaced by a residue V or an acetylated methionine (M01, in our notation) due to respectively a possible SAP or PTM. This information is encoded in our sequence file as shown in part (A). To encode the same information, method proposed in reference [11] would have up to five additional highly similar peptides separated by a letter "J" appended to the end of the primary sequence, see part (B). Here a lower case m is used to denote the acetylated methionine. Another key difference in the two methods shown above is on the limit of allowed number of enzymatic miscleavages. In our method, there is no limit on the number of allowed miscleavages, while in other approaches, the number of miscleavages is usually set to below a certain threshold. As an example, in our method, the variant peptides SPVCTWLILGSKEQTVTIR and SPmCTWLILGSKEQTVTIR are already included in (A). But in the approach of reference [11], in order to allow consideration of this variant peptide, one either needs to additionally append this peptide or to have much longer flanking peptides than shown in (B).
Figure 6
Figure 6
An Example of user-specific database construction. To construct a user-specific database, the user needs to provide a FASTA file containing sequences of interest and a flat information file documenting the SAPs/PTMs and disease information that the user wishes to consider. In this example, Id_Seq1 and Id_Seq2 represent sequence identifiers. In the information file, the format is as follows. First column indicates residue position; second column specifies whether the modification is a SAP or PTM; third column records the original residue in the sequence at position specified in the first column; fourth column consists of either a list of possible SAPs (L, I, V) or a list of possible PTMs (N08, N09, N10, N11, N12); fifth column documents disease names, if any, associated with the modifications at the specified positions. The user may then run our script, UserDb.pl, to generate the appropriate ".seq" and ".def" files suitable for searching using RAId_DbS. More detail can be found in the help page of RAId_DbS.
Figure 7
Figure 7
ROC curves obtained from different search modes. ROC curves for three different search modes employed when running RAId_DbS using the Aurum dataset composed of 9977 spectra. In panel (A) curves are shown in sensitivity versus (1-specificity), while in panel (B) the cumulative number of true positives versus the cumulative number of false positives are shown. In panel (B), the increase in the number of false positives coming from annotated SAPs/PTMs (red curve) and with novel SAPs (blue curve) is anticipated due to a larger search space compared to searches done within the standard database only. The larger total number of false positives found in the latter methods, however, will push the ROC curves leftwards upon normalizing to 1-specificity.

References

    1. Ceol A, Chart-Aryamontri A, Licata L, Cesareni G. Linking entries in protein interaction database to structure text: The FEBS Letters experiment. FEBS Letters. 2008;582:1171–1177. doi: 10.1016/j.febslet.2008.02.071. - DOI - PubMed
    1. Leitner F, Valencia A. A text-mining perspective on the requirements for electronically annotated abstracts. FEBS Letter. 2008;582:1178–1181. doi: 10.1016/j.febslet.2008.02.072. - DOI - PubMed
    1. Ioannidis JP. Why most published research findings are false. PLoS Med. 2005;2:e124. doi: 10.1371/journal.pmed.0020124. - DOI - PMC - PubMed
    1. Collins FS, Brooks LD, Chakravarti A. A DNA polymorphism discovery resource for research on human genetic variation. Genome Res. 1998;8:1229–1231. - PubMed
    1. Edwards NJ. Novel peptide identification from tandem mass spectra using ESTs and sequence database compression. Mol Syst Biol. 2007;3:102. - PMC - PubMed

Publication types

LinkOut - more resources