. 2009 Feb;93(2):159-68.
doi: 10.1016/j.ygeno.2008.09.017. Epub 2008 Nov 8.

Microarray transfection analysis of conserved genomic sequences from three immediate early genes

Affiliations

Microarray transfection analysis of conserved genomic sequences from three immediate early genes

Xiaomei Ren et al. Genomics. 2009 Feb.

Abstract

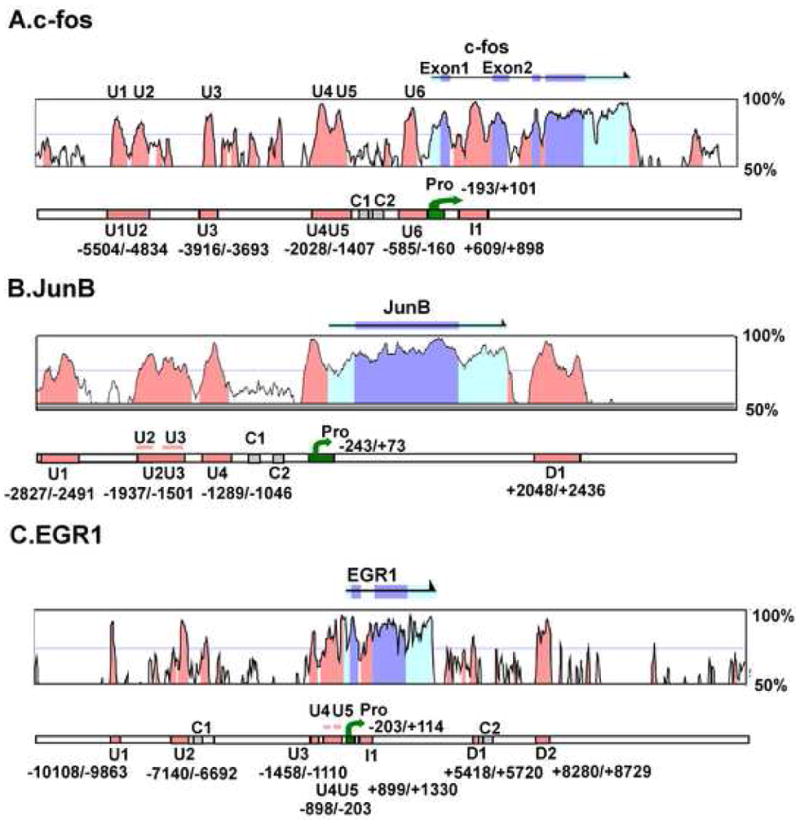
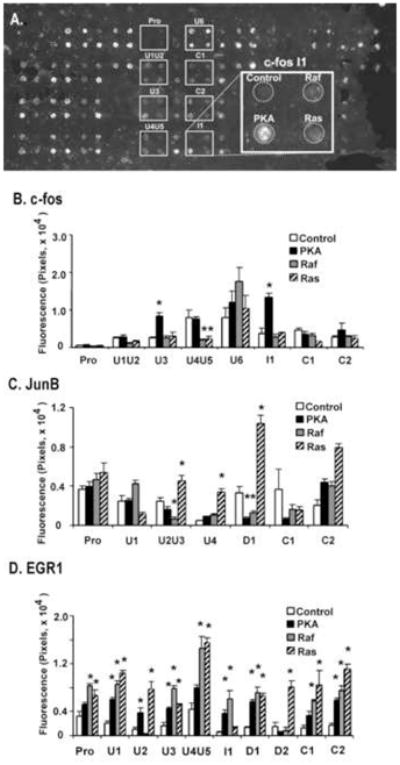
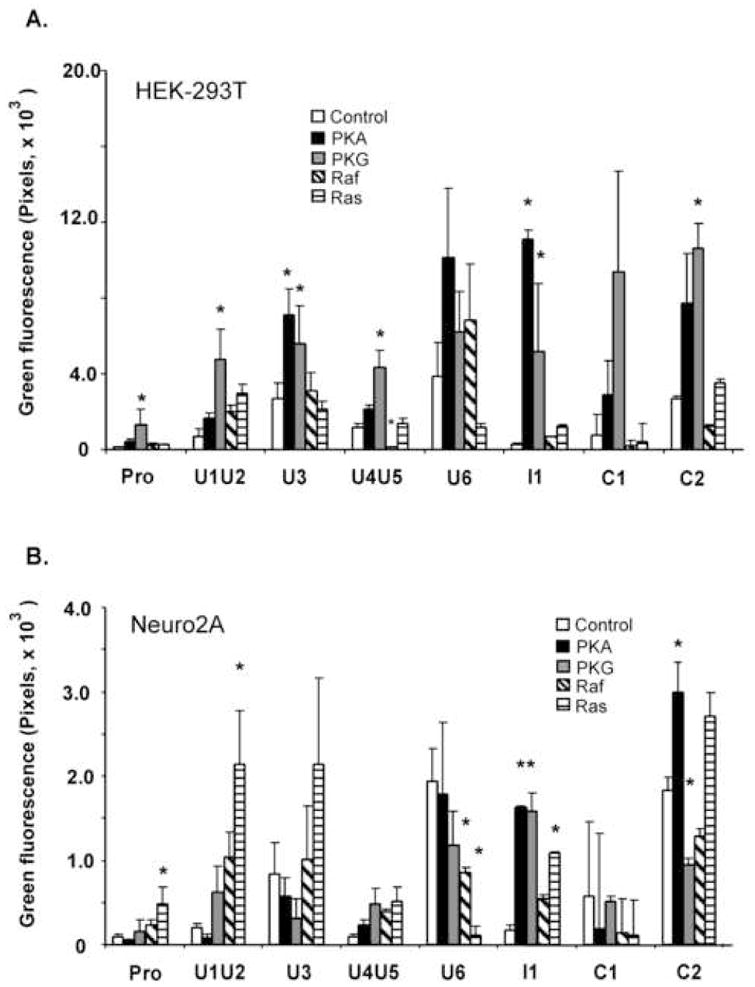
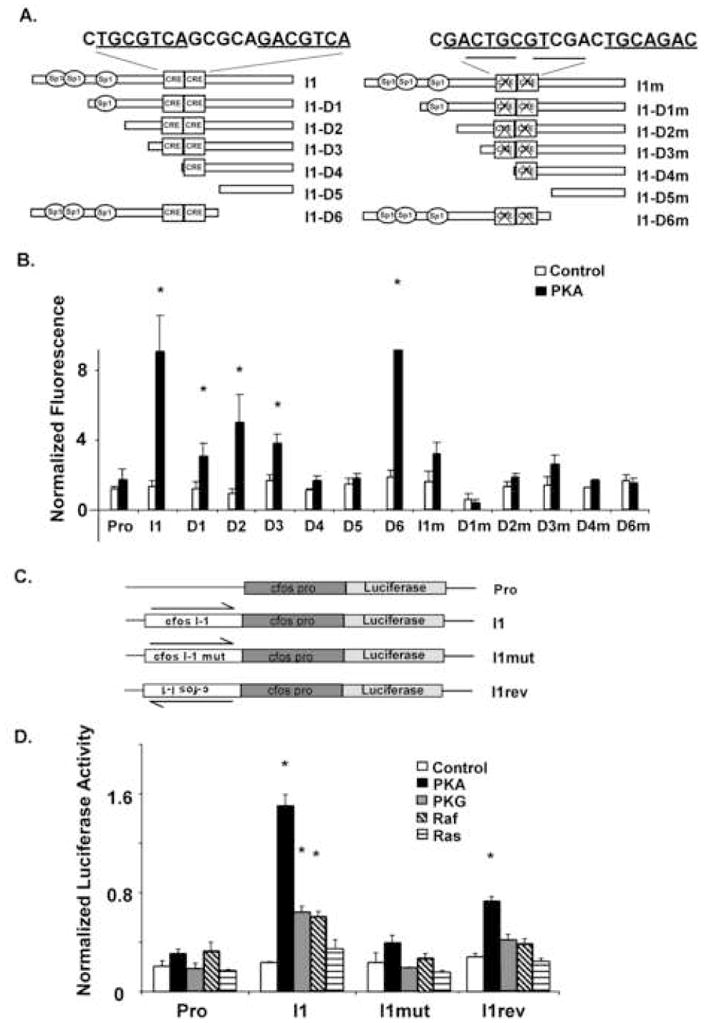
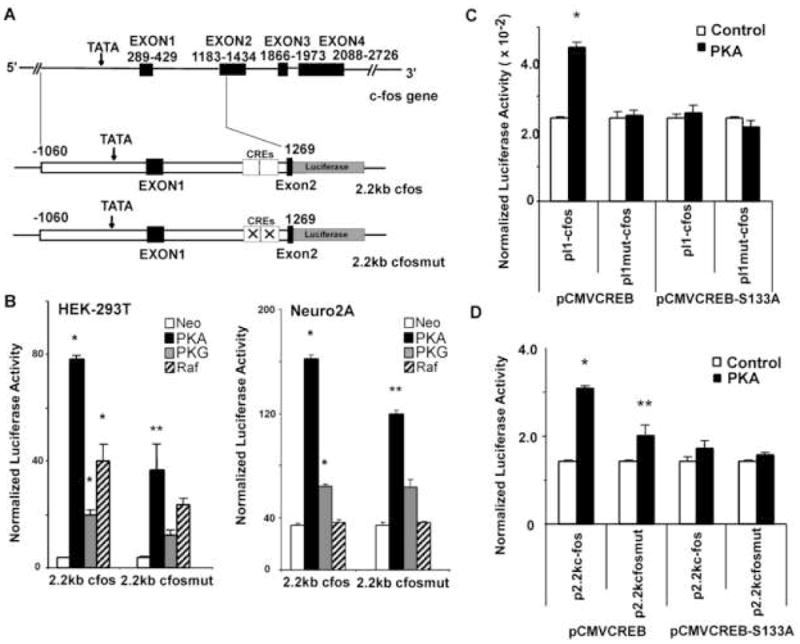
In an effort to define novel transcriptional regulatory elements, microarray cotransfection was used to functionally characterize conserved non-coding sequences (CNSs) of three immediate early genes: c-fos, JunB and EGR-1. Cotransfection of fluorescent CNS reporter constructs and expression vectors for constitutively active signaling proteins demonstrated that many of the CNSs alter both the basal and regulated expressions of reporter constructs, but the effects of these CNSs were usually specific for their homologous promoter. One CNS located in the first intron of the c-fos gene conferred regulation by cAMP-dependent protein kinase (PKA), cGMP-dependent protein kinase (PKG) and Raf. Mutagenesis and cotransfection experiments showed that PKA regulation of this c-fos intronic element was mediated by two adjacent CRE-like sequences and the transcription factor CREB. In the context of a reporter containing previously characterized regulatory elements, the novel intronic sequence contributed 50% of the transcriptional response to PKA. These studies suggest that microarray transfection studies may be useful in functional characterization of conserved genomic sequences on a larger scale.


Figures

Fig. 1
Fig. 1. Identification of highly conserved non-coding sequences (CNSs) within and adjacent to the c-fos, JunB and EGR1 immediate early genes
For c-fos (A), JunB (B), and EGR1 (C) the upper panel shows the nucleotide sequence identity between the corresponding mouse and human genomic sequences as analyzed by VISTA(http://pipeline.lbl.gov). The CNSs outside exonic regions which show more than 75% conservation are located and marked with orange. The arrows above the graph indicates the transcribed sequences and exons are marked with blue. The lower panel indicates the regions of CNSs and promoter used to construct reporters in later Fig. s. The promoter fragments are indicated in green, the CNSs are orange, and the control fragment (less than 60% conservation) are gray.
Fig. 2
Fig. 2. The presence of CNSs determine regulation of IEG EGFP reporters by constitutively activated signaling proteins
(A) The fluorescence of EGFP reporters in cells 48 hours after transfection is shown. Each small white rectangle indicates a set of four regions where a CNS reporter was co-transfected with one of four different expression vectors for constitutively active signaling proteins. Each rectangle corresponds to a 1.7mm × 2.0 mm region of the microscope slide. The larger rectangle shows at a higher magnification the cellular fluorescence associated with cells transfected with the I1c-fos CNS reporter and the constitutively active signaling proteins (Ras, Raf and PKA). For the c-fos (B), JunB (C) and EGR1 (D) reporters, the panels show representative STEP assay results in HEK-293T cells. The transfected DNA contained 90% of the indicated reporter plasmid and 5% of PKA, Ras or Raf expression vector or the control vector. The STEP assay was performed as described in Materials and Methods. For the results shown here, EGFP fluorescence was monitored from the living cells using fluorescence microscopy. Cellular fluorescence levels that show statistical significant differences (p<0.05)from the corresponding control cotransfections are indicated with an asterix (*).
Fig. 3
Fig. 3. Cell-type specific regulation of c-fos CNS sequences by five constitutively active signaling proteins
EGFP cellular fluorescence associated with STEP transfected HEK-293T cells (A) and Neuro2A neuroblastoma cells is shown. In both cell types, DNA contains 90% of c-fos CNS reporter plasmid and 10% of expression vector for the indicated constitutively active signaling protein or control vector (see Materials and Methods). At 48 or 60 hours after transfection, EGFP fluorescence was monitored from the living cells using fluorescence microscopy. Cellular fluorescence levels that show statistical significant differences (p<0.05)from the corresponding control cotransfections are indicated with an asterix (*).
Fig. 4
Fig. 4. Two cAMP response elements (CREs) within intron1 of the c-fos gene mediate PKA-induction of I1 reporter constructs
(A) Schematic structure of I1 and its 5′ progressive- or 3′ deletions. Left: I1 and its 5′ and 3′ deletion. Right: the corresponding mutations (mutation of both CRE) of the I1 related structure shown in left panel. All of the fragments were subcloned into an EGFP reporter plasmid containing the minimal c-fos promoter (see Materials and Methods). (B) Normalized EGFP fluorescence for the reporter constructs shown in panel A. The transfected DNA contained 90% of reporter plasmid and 5% of expression vector and 5% pCMVDsRed-1 (internal control). At 40 hours after transfection, slides were fixed with ice cold methanol and fluorescence was monitored using a fluorescence slide scanner (refer to Materials and Methods). Cellular fluorescence levels that show statistical significant differences (p<0.05) from the corresponding control cotransfections are indicated with an asterix (*). (C) Schematic structure of firefly luciferase reporter constructs. (D) Firefly luciferase reporter activities relative to the RL-SV40 renilla internal control are shown for cells at 24 hours after transfection in HEK-293T cells. For these solution transfection experiments, transfected DNA consisted of 5% reporters, 85% expression vectors, 5% pRL-SV40 and 5% EGFP-C1. EGFP expression was used for microscopic examination of transfected cells to ensure that transfection efficiencies were comparable on a cellular level. Normalized luciferase (firefly divided by Renilla) levels that show statistical significant differences (p<0.05) from the corresponding control cotransfections are indicated with an asterix (*).
Fig. 5
Fig. 5. The two CRE-like sequences within intron 1 regulate a c-fos reporter construct
(A) Schematic structure of c-fos gene and reporter constructs with the location of the CREs indicated. (B) Relative luciferase activity of the reporters at 24 hours following cotransfection with PKA, PKG and Raf expression vectors (normalized to the internal control of Renilla luciferase). Left: Normalized luciferase assay data (firefly over Renilla) from HEK-293T cells. Right: Normalized luciferase assay data from Neuro2A neuroblastoma cells. (C) Normalized luciferase activity of the reporters in which I1-c-fos promoter is immediately after I1 or its mutants. (D) Normalized luciferase activity of the reporters with I1 located in the first intron. F9 teratocarcinoma cells were transfected as described in Materials and Methods. Renilla (RL-US2) and firefly luciferase activities were determined 24 h after transfection. Normalized luciferase levels that show statistically significant differences (p<0.05) from the corresponding control cotransfections are indicated with an asterix (*). The double asterix (**) indicates samples that show statistically significant differences (p<0.05) from the corresponding wildtype reporter construct.

References

    1. Dermitzakis ET, Reymond A, Antonarakis SE. Conserved non-genic sequences - an unexpected feature of mammalian genomes. Nat Rev Genet. 2005;6:151–7. - PubMed
    1. Pennacchio LA, Ahituv N, Moses AM, Prabhakar S, Nobrega MA, Shoukry M, Minovitsky S, Dubchak I, Holt A, Lewis KD, Plajzer-Frick I, Akiyama J, De Val S, Afzal V, Black BL, Couronne O, Eisen MB, Visel A, Rubin EM. In vivo enhancer analysis of human conserved non-coding sequences. Nature. 2006;444:499–502. - PubMed
    1. Halfon MS, Gallo SM, Bergman CM. REDfly 2.0: an integrated database of cis-regulatory modules and transcription factor binding sites in Drosophila. Nucleic Acids Res. 2008;36:D594–8. - PMC - PubMed
    1. Wilson D, Charoensawan V, Kummerfeld SK, Teichmann SA. DBD--taxonomically broad transcription factor predictions: new content and functionality. Nucleic Acids Res. 2008;36:D88–92. - PMC - PubMed
    1. Zhang X, Odom DT, Koo SH, Conkright MD, Canettieri G, Best J, Chen H, Jenner R, Herbolsheimer E, Jacobsen E, Kadam S, Ecker JR, Emerson B, Hogenesch JB, Unterman T, Young RA, Montminy M. Genome-wide analysis of cAMP-response element binding protein occupancy, phosphorylation, and target gene activation in human tissues. Proc Natl Acad Sci U S A. 2005;102:4459–64. - PMC - PubMed

Publication types

Substances