. 2008 Dec 19;283(51):35983-95.
doi: 10.1074/jbc.M805345200. Epub 2008 Oct 27.

Structure of the yeast vacuolar ATPase

Affiliations

Structure of the yeast vacuolar ATPase

Zhenyu Zhang et al. J Biol Chem. .

Abstract

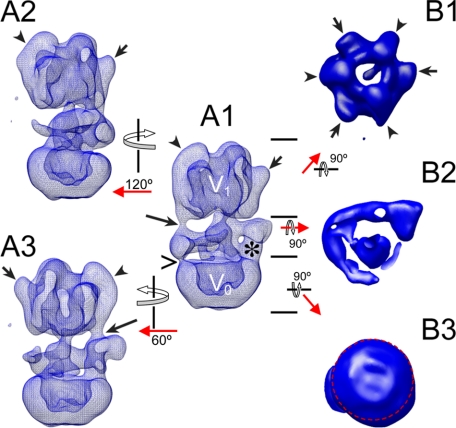
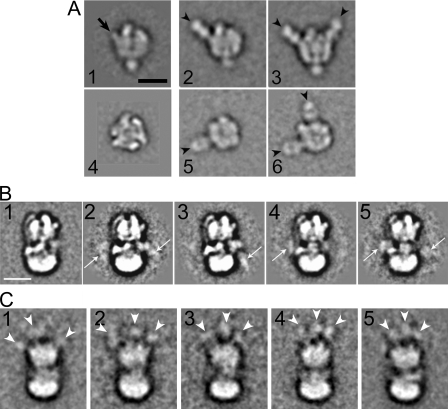
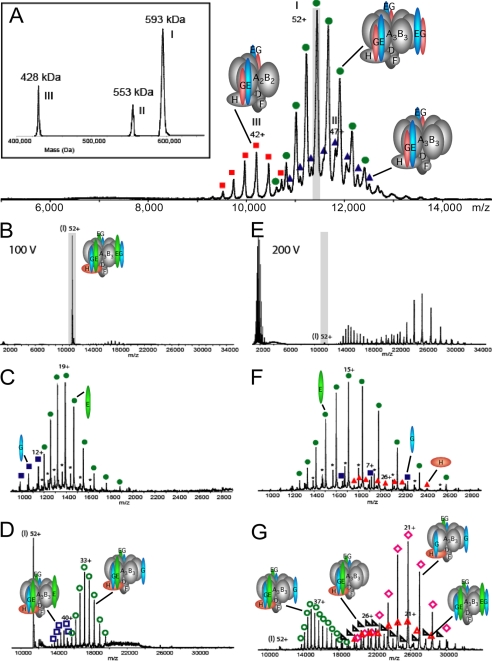
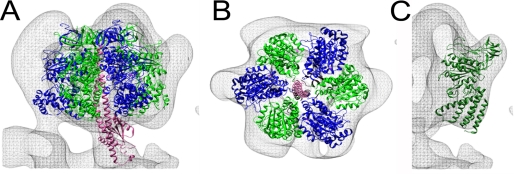
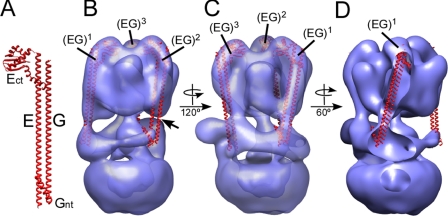
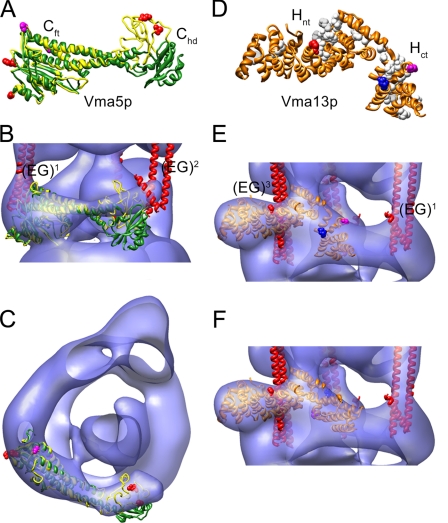
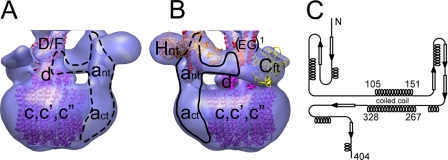
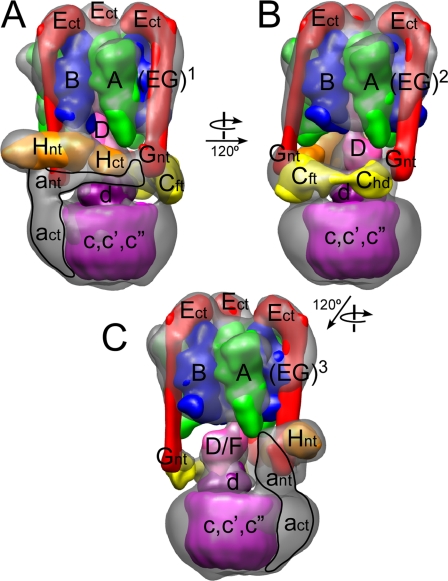
The subunit architecture of the yeast vacuolar ATPase (V-ATPase) was analyzed by single particle transmission electron microscopy and electrospray ionization (ESI) tandem mass spectrometry. A three-dimensional model of the intact V-ATPase was calculated from two-dimensional projections of the complex at a resolution of 25 angstroms. Images of yeast V-ATPase decorated with monoclonal antibodies against subunits A, E, and G position subunit A within the pseudo-hexagonal arrangement in the V1, the N terminus of subunit G in the V1-V0 interface, and the C terminus of subunit E at the top of the V1 domain. ESI tandem mass spectrometry of yeast V1-ATPase showed that subunits E and G are most easily lost in collision-induced dissociation, consistent with a peripheral location of the subunits. An atomic model of the yeast V-ATPase was generated by fitting of the available x-ray crystal structures into the electron microscopy-derived electron density map. The resulting atomic model of the yeast vacuolar ATPase serves as a framework to help understand the role the peripheral stalk subunits are playing in the regulation of the ATP hydrolysis driven proton pumping activity of the vacuolar ATPase.


Figures

FIGURE 1.
FIGURE 1.
Three-dimensional structural model of the yeast vacuolar ATPase. The model was calculated from a data set of 25,000 single images at ∼25 Å resolution. The short arrows and arrowheads point to the elongated- and knob-like densities at the top of the V1. The long arrows point to the peripheral stalks resolved in the three-dimensional model. The > sign points to a thin connection between subunit C and the membrane domain (see below for a discussion on the binding position of subunit C). The asterisk indicates the location of the N-terminal domain of subunit a (ant). The short arrows and arrowheads in B1 point to the alternating A and B subunits in the V1, respectively. The image in B2 shows the arc-like arrangement of the peripheral stalk proteins surrounding the central stalk. The image in B3 shows the bottom view of the V0. The asymmetry of the V0 is indicated by the red circle. For details, see text.
FIGURE 2.
FIGURE 2.
Immunolocalization of subunits A, G, and E yeast V-ATPase. A, image analysis of V1-ATPase labeled with anti-A Fab. Images 1 and 4 show top and side view of unlabeled V1 (30). Images 2 and 3 show side views and 5 and 6 top views of anti-A Fab-labeled V1. Averages were obtained that showed either one (images 2 and 5) or two Fabs bound. No averages with three Fab bound were seen in this analysis, possibly due to steric hindrance of the third antibody binding site. Images 2 and 3 are from Ref. . Averages 1-6 were calculated from ∼200 single molecule images each. B, yeast V-ATPase containing a FLAG tag fused to the N terminus of subunit G was labeled with anti-FLAG monoclonal antibody. Averages (∼250 images each) show additional density due to the IgG either on one side (see arrows in images 3 and 4) or on both sides (images 2 and 5). C, V-ATPase containing three HA tags fused to the C terminus of subunit E was labeled with anti-HA monoclonal antibody. Despite the overall lower quality of the averages (100-150 images each), three additional densities can be seen at the top of the V1 domain. For details, see text. Bars = 10 nm.
FIGURE 3.
FIGURE 3.
Tandem mass spectrometry of yeast V1-ATPase. A, electrospray ionization mass spectrometry spectrum of intact V1-ATPase (taken from Ref. 47) showing three species. The 52+ charge state of the most abundant complex (593 kDa; I), which has the stoichiometry A3B3DE3FG3H was selected for collisional activation, highlighted in gray. B-G, tandem mass spectra of V1-ATPase sprayed from aqueous 100 mm ammonium acetate, pH 6.8. Dissociation of the 52+ ion of the 593-kDa V1-ATPase complex at a collision voltage of 100 V (B) with zoom in the m/z regions 900-2,900 (C) and 9,000-34,000 (D). Dissociation of the 52+ ion of the complex at a collision voltage of 200 V (E) with zoom in the m/z regions 900-2,900 (F) and 9,000-34,000 (G). The dissociated subunits E, G, and H are represented by green circle, blue square, and red triangle, respectively. The product ions of five different complexes are indicated by the empty green circle (loss of one subunit E), empty pink rhombus (loss of two subunits E), empty blue square (loss of one subunit G), empty black triangle (loss of one subunit G and one subunit E), and empty red triangle (loss of one subunit H). The charge series marked with a asterisk corresponds to a degraded form of subunit E.
FIGURE 4.
FIGURE 4.
Fitting of F1-ATPase α3β3 catalytic domain, central rotor, and A-ATPase A subunit into the yeast V-ATPase three-dimensional model. A, side view, and B, top view of the resulting fit. The subunits are α (blue), β (green), and γ (pink). C, manual fitting of the partial structure of the A-ATPase subunit A (PDB 1vdc) into the yeast V-ATPase model. For details of the fitting procedure, see “Experimental Procedures” and supplemental Table S2.
FIGURE 5.
FIGURE 5.
Fitting of the EG structural model into the yeast V-ATPase three-dimensional model. A, structural model of the EG heterodimer. The model is based on the crystal structure of the C-terminal domain of the A-ATPase E subunit (Ect; PDB 2dma) as well as secondary structure and coiled coil prediction (44). B and C, fitting of the three copies of the EG heterodimer into the V-ATPase three-dimensional model. D, in this orientation, part of the density is cut away to allow a view inside the three-dimensional model. As can be seen, the stators connect the B subunits and the collar domain at an angle (most pronounced for stator EG1 where the angle is ∼20°).
FIGURE 6.
FIGURE 6.
Fitting of subunit C and H crystal structures into the yeast V-ATPase three-dimensional model. A, overlay of the high (green) and low (yellow) conformers of subunit C (PDB 1u7l; Ref. 42). As can be seen, the foot domains (Cft) match well, whereas the position of the head domains (Chd) varies, indicating some flexibility of the two domains. Coordinates of the low-resolution conformer were kindly provided by Dr. Nathan Nelson. The sites from where cross-linking to EG has been observed (34) are in red spacefill. B and C, fitting of both subunit C conformers into the V-ATPase three-dimensional model reveals a better fit for the low-resolution conformer. D, crystal structure of subunit H (PDB 1ho8; Ref. 43) showing an N-terminal domain (Hnt) and a C-terminal domain (Hct). Conserved residues are in white spacefill. Residues from where cross-links to subunits E, B, and F have been observed (54) are in red, blue, and magenta spacefill, respectively. E, fitting of the crystal structure of subunit H into the V-ATPase three-dimensional model. In this orientation, the sites cross-linking to B and F are on the outside. The Hct domain was therefore fitted separately (see panel F) in accordance with the independent behavior of the two domains as reported for the yeast enzyme (55).
FIGURE 7.
FIGURE 7.
Schematic model of the V0 domain. A, fitting of the k10 proteolipid ring (purple; PDB 2bl2), the homology model of yeast subunit d (magenta; modeled after the homologous subunit C of the bacterial A/V-ATPase (PDB 1r5z)), and the middle domain of the F-ATPase γ subunit (pink; PDB 1e79). Currently, there is no structure for subunit D from any species. B, proposed arrangement of the N-terminal domain of subunit a (ant). The arrangement is based on secondary structure and coiled coil prediction (EXPASY) as shown in panel C. For details, see text.
FIGURE 8.
FIGURE 8.
Model of the subunit arrangement in the yeast V-ATPase. The crystal structures used for fitting were low pass filtered to 20-Å resolution and rendered as three-dimensional volumes before fitting into the electron density three-dimensional envelope of the V-ATPase. The structures used for fitting were the homology models of the yeast A (green) and B (blue) subunits (modeled based on PDB 1vdc and PDB 2c61, respectively), the γ subunit from mitochondrial F1-ATPase (PDB 1e79; pink), the H and C subunits from yeast V-ATPase (H, PDB 1ho8, orange; C, Ref. , yellow), the structural model of the EG heterodimer (red; containing PDB 2dma), the homology model of yeast subunit d (magenta; modeled after bacterial V-ATPase C subunit, PDB 1r5z), and the k10 proteolipid ring (PDB 2bl2; purple). No representative structure is available for the N-terminal domain of the a subunit. A structure for subunit F is available (PDB 2d00) but the small size of the subunit (∼11 kDa) makes docking unreliable. Subunit e (Vma9p; 14) is not included in the model as there is insufficient information regarding its binding location.

References

    1. Forgac, M. (2007) Nat. Rev. Mol. Cell. Biol. 8 917-929 - PubMed
    1. Kane, P. M. (2006) Microbiol. Mol. Biol. Rev. 70 177-191 - PMC - PubMed
    1. Marshansky, V., and Futai, M. (2008) Curr. Opin. Cell Biol., 20 415-426 - PMC - PubMed
    1. Alper, S. L. (2002) Annu. Rev. Physiol. 64 899-923 - PubMed
    1. Kornak, U., Schulz, A., Friedrich, W., Uhlhaas, S., Kremers, B., Voit, T., Hasan, C., Bode, U., Jentsch, T. J., and Kubisch, C. (2000) Hum. Mol. Genet. 9 2059-2063 - PubMed

Publication types

MeSH terms

LinkOut - more resources