. 2008 Nov 3;183(3):527-42.
doi: 10.1083/jcb.200805076. Epub 2008 Oct 27.

Endothelial adhesion receptors are recruited to adherent leukocytes by inclusion in preformed tetraspanin nanoplatforms

Affiliations

Endothelial adhesion receptors are recruited to adherent leukocytes by inclusion in preformed tetraspanin nanoplatforms

Olga Barreiro et al. J Cell Biol. .

Abstract

VCAM-1 and ICAM-1, receptors for leukocyte integrins, are recruited to cell-cell contact sites on the apical membrane of activated endothelial cells. In this study, we show that this recruitment is independent of ligand engagement, actin cytoskeleton anchorage, and heterodimer formation. Instead, VCAM-1 and ICAM-1 are recruited by inclusion within specialized preformed tetraspanin-enriched microdomains, which act as endothelial adhesive platforms (EAPs). Using advanced analytical fluorescence techniques, we have characterized the diffusion properties at the single-molecule level, nanoscale organization, and specific intradomain molecular interactions of EAPs in living primary endothelial cells. This study provides compelling evidence for the existence of EAPs as physical entities at the plasma membrane, distinct from lipid rafts. Scanning electron microscopy of immunogold-labeled samples treated with a specific tetraspanin-blocking peptide identify nanoclustering of VCAM-1 and ICAM-1 within EAPs as a novel mechanism for supramolecular organization that regulates the leukocyte integrin-binding capacity of both endothelial receptors during extravasation.


Figures

Figure 1.
Figure 1.
VCAM-1 and ICAM-1 are copresented at lymphocyte–endothelium contact sites independently of ligand binding and actin anchorage. (A) K562 α4 or LFA-1 was adhered (30 min) to TNF-α–activated HUVECs. Samples were fixed and double stained with anti–VCAM-1 (P8B1) and biotin-conjugated anti–ICAM-1 (MEM111). Confocal stacks were obtained, and orthogonal maximal projections and vertical three-dimensional reconstructions of the whole series are displayed. (B) Human T lymphoblasts were pretreated (5 min) with 10 μM BIRT377 or 10 μg/ml BIO5192 to inactivate LFA-1 or VLA-4 and were added to TNF-α–activated HUVECs for 5 min. Fixed cells were double stained as in A. Confocal stacks were obtained, and a representative section from each treatment is shown together with its corresponding colocalization histogram and a mask showing the distribution of double green-red pixels (marked regions) within the cell. (C) Resting HUVECs transfected with VCAMΔCyt were incubated with K562 α4 (i), K562 LFA-1 (ii), or T lymphoblasts (iii). Fixed cells were double stained with anti–VCAM-1 (VCAMΔCyt was the only VCAM-1 species detected) and biotin-conjugated anti–ICAM-1. Confocal stacks were obtained; representative sections or vertical reconstructions of the whole series are displayed. Arrows show positions of adhered leukocytes. The deleted sequence in the VCAMΔCyt construct is shown in red below the figure. TM, transmembrane; Cyt Dom, cytoplasmic domain. Bars: (A and C) 20 μm; (B) 10 μm.
Figure 2.
Figure 2.
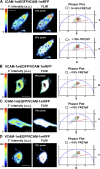
VCAM-1 and ICAM-1 do not interact at the plasma membrane. Endothelial cells were cotransfected with mEGFP–mRFP1 pairs (ICAM-1–ICAM-1, VCAM-1–VCAM-1, ICAM-1–VCAM-1, and VCAM-1–ICAM-1). A representative FRET–FLIM analysis using the phasor plot is shown for each pair. The sine (s) and cosine (g) transforms of the lifetime data measured in the frequency mode generate the coordinate system presented in the phasor (Digman et al., 2008). Fluorescence intensity (F. intensity) images are in pseudocolor (left), and corresponding mEGFP lifetime distributions are shown in the plots after the phasor transformation (right). In each phasor plot, the green line represents 0% FRETeff and the red line marks 50% FRETeff (Caiolfa et al., 2007). The black circular cursors in the phasor plots select the subset of pixels shown in the correlated FLIM images (pink mask for positive FRET and white mask for negative FRET; middle). For the ICAM-1–ICAM-1 pair (A), most pixels lie very close to the green line (FRETeff ≤10%; negligible), but 12% of pixels exhibit FRETeff of 14–34%. These positive pixels are localized in clusters, as shown by the FLIM image (pink mask). Other protein pairs (B–D) show phasor distributions indistinguishable from that of the negative controls (Fig. S1 A, available at http://www.jcb.org/cgi/content/full/jcb.200805076/DC1). a.u., arbitrary units. Bars, 20 μm.
Figure 3.
Figure 3.
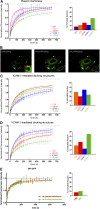
EAP component dynamics at nude membrane and docking structures. (A) Endothelial cells were transiently transfected with CD9-, CD151-, ICAM-1–, VCAM-1–, or GPI-EGFP and activated with TNF-α. FRAP curves from comparable areas of nude plasma membrane were acquired and fitted by a simple diffusion model. Mean-fitted fluorescence recovery curves ± SEM are depicted on the overlay graphic. (B) Representative FRAP analysis at an endothelial docking structure. Prebleaching image shows an ICAM-1–EGFP-transfected endothelial cell with docking structures formed around attached K562 LFA-1 cells (circles of high fluorescence). The boxed docking structure, shown in the inset at high magnification during bleaching, was selected for photobleaching recovery. Bar, 20 μm. (C and D) Mean-fitted fluorescence recovery curves ± SEM for ICAM-1–, VCAM-1–, CD9-, and CD151-EGFP at docking structures (comparable areas) formed around K562 LFA-1 or K562 α4. (E) Mean-fitted fluorescence recovery curves ± SEM for GPI-EGFP at plasma membrane (PM) or docking structures (DS; comparable areas). Immobile fractions calculated from fitted curves are shown in the bar histograms. Statistical analysis and number of experiments are shown in Table S2 (available at http://www.jcb.org/cgi/content/full/jcb.200805076/DC1).
Figure 4.
Figure 4.
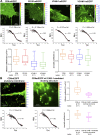
EAP component diffusion at nude membrane and docking structures. (A) Representative FCS measurements at plasma membranes of transiently transfected primary HUVECs expressing very low levels of CD9-, CD151-, ICAM-1–, or VCAM-1–mEGFP. For each condition, the figure shows the fluorescence intensity image (kCPS, kilo counts per second), the ACF (black line) derived from the fluorescence intensity trace acquired at the point marked with a white cross, the best-fitted curve using an anomalous diffusion model (red line), and the diffusion (D) and anomality (α) coefficients. In the FCS autocorrelation curves, the x axis (τ) represents the delay time in seconds, and the y axis (G(τ)) is the autocorrelation amplitude as a function of delay time. Box-whisker plots show distributions of D and α values obtained from several transiently transfected HUVEC batches using mEGFP and mRFP1 versions of the four proteins; minimum, 25th percentile, median, 75th percentile, and maximum values are shown. (B) Representative FCS measurements of CD9-mGFP at the plasma membrane and an endothelial ICAM-1–mediated docking structure formed around an adhered K562 LFA-1 cell. The same parameters described in A are shown. Box-whisker plots compare data from the plasma membrane (reproduced from A) with data from docking structures. Statistical analysis and number of experiments are reported in Table S3 (available at http://www.jcb.org/cgi/content/full/jcb.200805076/DC1).
Figure 5.
Figure 5.
Specificity of molecular interactions in EAP HUVECs transfected with mEGFP–mRFP1 pairs (CD9–CD9, CD9–CD151, ICAM-1–CD9, and VCAM-1–CD151). FRET–FLIM analysis was performed as in Fig. 2. For each FRET pair, the figure shows the fluorescence intensity (F. intensity) image (in pseudocolor scale), the phasor plot, and the FLIM image corresponding to the cursor selection in phasors (black circles), with the location of the highest FRETeff population illustrated with the pink mask (14–34% FRETeff). a.u., arbitrary units; s, sine; g cosine. Bars, 20 μm.
Figure 6.
Figure 6.
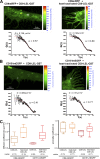
CD9-LEL-GST perturbs EAP dynamics. (A and B) Representative FCS measurements at the plasma membrane of endothelial cells transiently cotransfected with CD9-mRFP1 (A) and CD151-mEGFP (B) and treated with 250 μg/ml active or heat-inactivated CD9-LEL-GST. The figure shows the fluorescence intensity image, the ACF (black lines) derived from the fluorescence intensity trace acquired at the point marked with a white cross, the best-fitted curve using an anomalous diffusion model (red lines), and D and α coefficients. (C) Box-whisker plots show distributions of D and α values (as in Fig. 4). Statistical analysis and number of experiments are presented in Table S3 (available at http://www.jcb.org/cgi/content/full/jcb.200805076/DC1). kCPS, kilo counts per second.
Figure 7.
Figure 7.
Tetraspanins regulate endothelial adhesion receptor nanoclustering. (A) TNF-α–activated endothelial cells were fixed and stained with anti–VCAM-1 or anti–ICAM-1 followed by 40-nm gold immunolabeling. Representative scanning electron microscope negative images of the endothelial plasma membrane are shown. Mean cluster number and size ± SEM for VCAM-1– and ICAM-1–containing microdomains analyzed in images with low or high particle number (i.e., indirect measurement of low or high receptor expression). Clustering parameters: δ = 100 and λ = 1 (see Materials and methods). (B) Gold particle coordinates from individual scanning electron microscope images (15-μm2 plasma membrane) were used to compute nearest neighbor distances (see Materials and methods). Graphs show comparison of VCAM-1 or ICAM-1 nanoclustering based on nearest neighbor profiles from control, CD9-LEL-GST–, and heat-inactivated CD9-LEL-GST–treated samples with statistically comparable numbers of particles. The bar plot represents the mean of the Euclidean distance of the nearest neighbor for the total of n particles in the several images analyzed for each treatment. (C) Clustering rates were computed from the samples in B (see Materials and methods). Clustering parameters: VCAM-1, δ = 205 and λ = 2; and ICAM-1, δ = 140 and λ = 2. Statistical significance in the figure was based on a Student's t test.
Figure 8.
Figure 8.
Scheme of tetraspanin-enriched EAPs and docking structures. (top middle) Scanning electron microscopy image of a peripheral blood lymphocyte interacting with the apical membrane of an endothelial cell under flow conditions. The green square marks a zone of nude membrane containing EAPs as shown at high magnification in the left panel. The red square highlights the endothelial docking structure, as shown at a nanometric scale in the right panel. EAPs are preformed nanoclusters that serve as nucleating units for integrin ligands and their tetraspanin partners, whereas docking structures are microscopic clusters of EAPs organized in microvilli around adherent leukocytes. (bottom middle) Immunofluorescence staining showing the macroscopic appearance of EAPs and docking structures. K562 LFA-1 was adhered (30 min) to TNF-α–activated HUVECs. Samples were fixed and double stained with anti–PECAM-1 and biotin-conjugated anti–ICAM-1. Confocal stacks were obtained, and an orthogonal maximal projection is displayed. Microscopic-sized clusters of EAPs in this image. (left) Activated endothelial cells were fixed and double stained with 40 nm VCAM-1 and 15-nm ICAM-1 gold particles. The panel shows a representative negative scanning electron microscopy image from the nude apical endothelial plasma membrane. The white asterisks mark the 15-nm anti–ICAM-1 gold particles, and the black dots are the 40-nm anti–VCAM-1 gold particles. The white boxes depict regions of VCAM-1–ICAM-1 heteroclustering, whereas the black box shows an ICAM-1 homoclustering zone. (right) T lymphoblasts were adhered to activated endothelial cells (5 min). Fixed cells were stained with anti–ICAM-1 and 40-nm immunolabeled gold. A representative negative scanning electron microscopy image shows the preferential localization of gold particles at the microvilli of the endothelial docking structure formed around a lymphoblast, where EAPs coalesce.

Comment in

References

    1. Anderson, R.G., and K. Jacobson. 2002. A role for lipid shells in targeting proteins to caveolae, rafts, and other lipid domains. Science. 296:1821–1825. - PubMed
    1. Banks, D.S., and C. Fradin. 2005. Anomalous diffusion of proteins due to molecular crowding. Biophys. J. 89:2960–2971. - PMC - PubMed
    1. Barreiro, O., M. Yanez-Mo, J.M. Serrador, M.C. Montoya, M. Vicente-Manzanares, R. Tejedor, H. Furthmayr, and F. Sanchez-Madrid. 2002. Dynamic interaction of VCAM-1 and ICAM-1 with moesin and ezrin in a novel endothelial docking structure for adherent leukocytes. J. Cell Biol. 157:1233–1245. - PMC - PubMed
    1. Barreiro, O., M. Yanez-Mo, M. Sala-Valdes, M.D. Gutierrez-Lopez, S. Ovalle, A. Higginbottom, P.N. Monk, C. Cabanas, and F. Sanchez-Madrid. 2005. Endothelial tetraspanin microdomains regulate leukocyte firm adhesion during extravasation. Blood. 105:2852–2861. - PubMed
    1. Berditchevski, F. 2001. Complexes of tetraspanins with integrins: more than meets the eye. J. Cell Sci. 114:4143–4151. - PubMed

Publication types

MeSH terms