. 2008 Nov 3;183(3):543-54.
doi: 10.1083/jcb.200806030. Epub 2008 Oct 27.

Segregation and activation of myosin IIB creates a rear in migrating cells

Affiliations

Segregation and activation of myosin IIB creates a rear in migrating cells

Miguel Vicente-Manzanares et al. J Cell Biol. .

Abstract

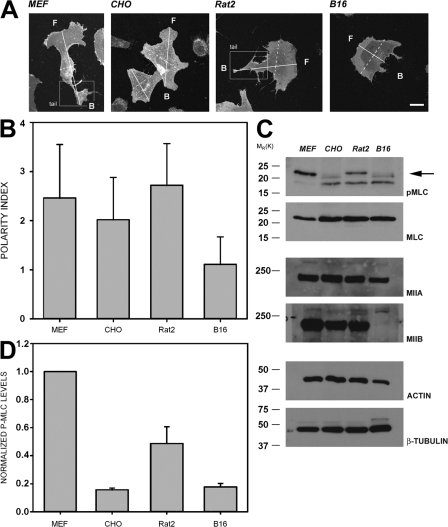
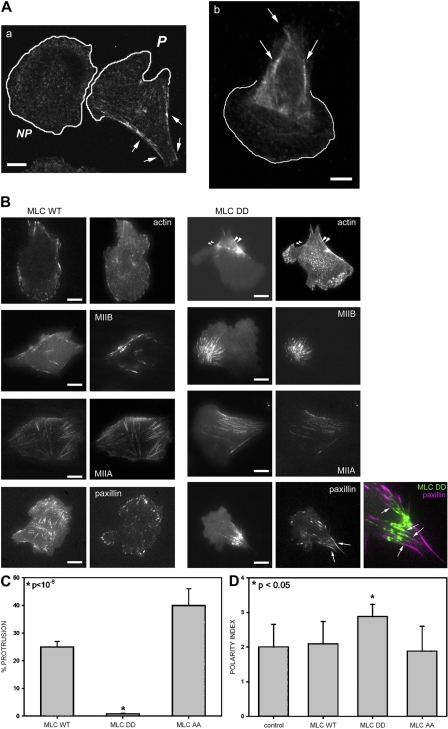
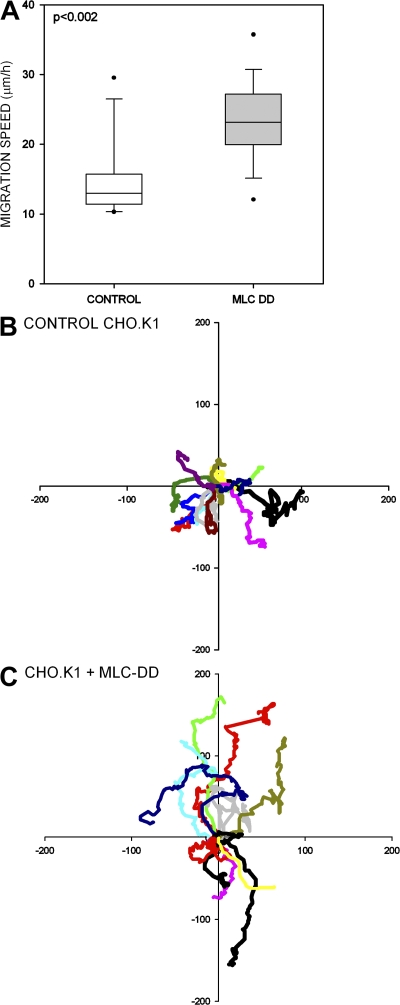
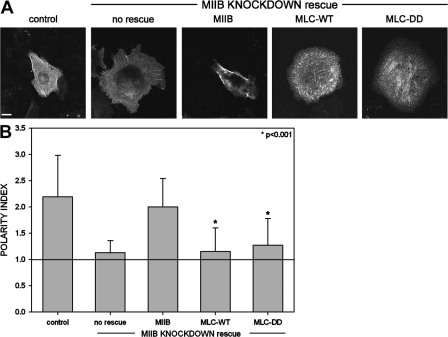
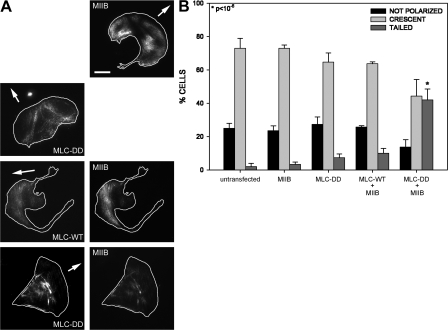
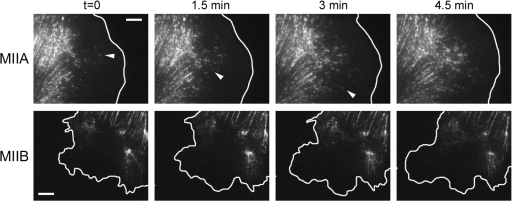
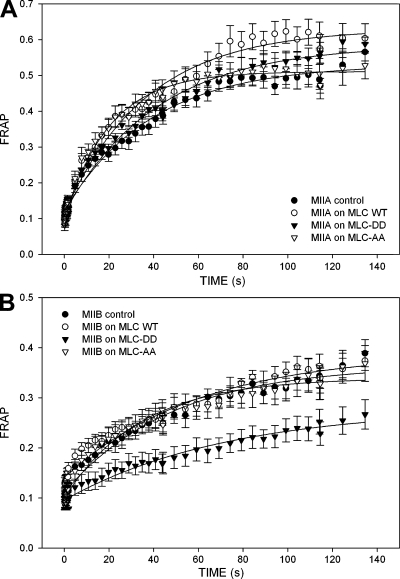
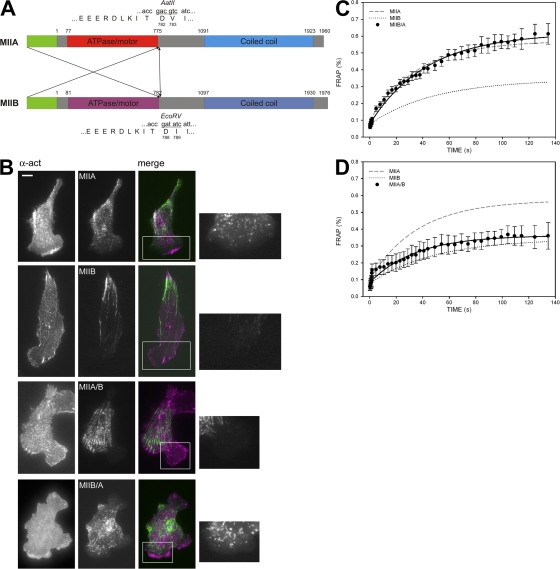
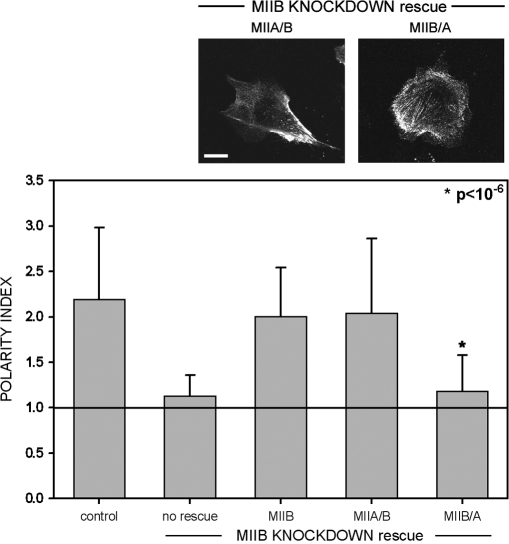
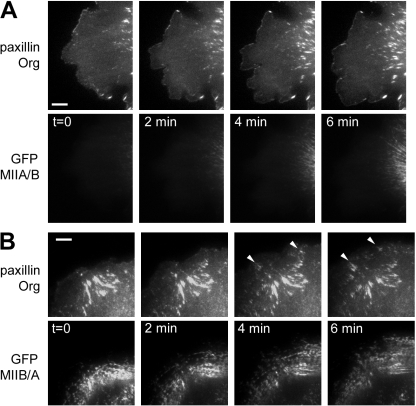
We have found that MLC-dependent activation of myosin IIB in migrating cells is required to form an extended rear, which coincides with increased directional migration. Activated myosin IIB localizes prominently at the cell rear and produces large, stable actin filament bundles and adhesions, which locally inhibit protrusion and define the morphology of the tail. Myosin IIA forms de novo filaments away from the myosin IIB-enriched center and back to form regions that support protrusion. The positioning and dynamics of myosin IIA and IIB depend on the self-assembly regions in their coiled-coil C terminus. COS7 and B16 melanoma cells lack myosin IIA and IIB, respectively; and show isoform-specific front-back polarity in migrating cells. These studies demonstrate the role of MLC activation and myosin isoforms in creating a cell rear, the segregation of isoforms during filament assembly and their differential effects on adhesion and protrusion, and a key role for the noncontractile region of the isoforms in determining their localization and function.


Figures

Figure 1.
Figure 1.
A polarized morphology correlates with the amount of phosphoMLC in different cells. (A) Representative morphologies of DiI-stained CHO.K1, MEF, B16, and Rat2 cells plated on fibronectin for 30 min. F, front; B, back. Representative axes are used to calculate the polarity index (PI) as shown in B. Solid line is the migration axis; dashed line is the transverse axis. Bar, 10 μm. (B) Polarity indices (long migratory axis divided by short transversal axis) of the cell lines shown in A under the same experimental conditions. Data represent the average ± SD of >200 cells in two independent experiments. (C) Phosphorylation of MLC and expression of myosin II heavy chain isoforms in the cell lines shown in A. The cells were plated under the same conditions. Arrow points to the P-MLC band. Representative immunoblots from four individual experiments are shown. (D) Densitometric analysis of the phosphorylation of MLC as shown in C. Values are normalized with respect to the amount of actin in control blots, and normalized values referred to the amount of P-MLC present in MEFs. Data represent the mean ± SD of four independent experiments.
Figure 2.
Figure 2.
Phosphomimetic MLC locally inhibits protrusion and induces formation of an extended tail. (A) Localization of phosphorylated MLC at the rear of polarized cells. Confocal images were obtained using phosphorylated MLC antibody in polarized (P) or nonpolarized (NP) CHO.K1 cells (a) and highly polarized Rat2 cells (b). Arrows point to bundles of phosphorylated MLC at the rear. Bar, 10 μm. (B) TIRF images of CHO.K1 cells expressing wild-type MLC (left panels) or the phosphomimetic MLC-DD mutant (right panels), coexpressing actin, MIIB, MIIA, or paxillin. Bar, 10 μm. Arrowheads point to MLC-DD and actin bundles, whereas arrows point to elongated adhesions at the rear. Color inset shows a detail of the localization of paxillin (magenta) and MLC-DD. Note the almost complete lack of colocalization (arrows). Video 1 accompanies this figure and shows a cell coexpressing MLC-DD-mChe and GFP-MIIB (Video 1 available at http://www.jcb.org/cgi/content/full/jcb.200806030/DC1). (C) Effect of MLC-DD on local protrusion. CHO.K1 cells were transfected with the indicated GFP-coupled MLC mutants and mCherry to define the morphology of the cell. Protrusion was then analyzed by kymography locally in the vicinity of MLC-decorated bundles. From this, the fraction of cells showing net productive protrusion in the vicinity of the MLC bundles over 10 min was scored as a positive. Data represent the mean ± SD of >50 cells analyzed per condition in three independent experiments. *, Student's t test of MLC-DD vs. MLC-WT. (D) Effect of MLC-DD in cellular polarization. The polarity indices of CHO.K1 cells expressing the indicated construct were scored. Data represent the mean ± SD of >200 cells analyzed per condition in three independent experiments. *, Student's t test of MLC-DD vs. control/MLC-WT.
Figure 3.
Figure 3.
MLC activation promotes cell migration. (A) Velocities of control and MLC-DD-expressing CHO.K1 cells migrating on fibronectin. Data are box plots, which have the median value and extreme values, as well as the quartile distribution (boxed regions) of velocities of control (n = 22) and MLC-DD (n = 24) expressing cells from five independent experiments. (B and C) Migratory behavior of control (B) and MLC-DD (C) expressing CHO.K1 cells. The plots are cell tracks, derived from 6–10 h phase-contrast videos, translated to a common origin. Distance is in micrometers.
Figure 4.
Figure 4.
MIIB creates a cellular tail. (A) Representative images of a control or MIIB-deficient CHO.K1 cells, coexpressing control GFP-actin, RNAi-insensitive GFP-MIIB, and MLC-WT-GFP or MLC-DD-GFP. Note that MLC-DD does not rescue the polarity loss induced by depletion of MIIB. Bar, 10 μm. (B) Polarity index of CHO.K1 cells in the conditions shown in A. Data represent the mean ± SD of >100 cells analyzed per condition in four independent experiments. *, Student's t test of MLC-WT and MLC-DD vs. control.
Figure 5.
Figure 5.
MIIB activation by MLC-DD generates a cellular trailing edge. (A) Representative images of B16 cells expressing GFP-MIIB, MLC-DD-GFP, MLC-WT-mChe + GFP-MIIB, or MLC-DD-mChe + GFP-MIIB. Bar, 10 μm. Note the formation of a robust tail in the cell expressing MLC-DD-mChe + GFP-MIIB. Video 2 accompanies this figure and represents a cell expressing MLC-DD-mChe. Note the anterior distribution of MLC-DD. (B) Quantification of the phenotypes described in A. Percentage of cells displaying the indicated morphology. Morphologies were defined as follows: “not polarized” are cells with a P.I <1.5; “crescent” are cells morphologically similar to those shown in Fig. 4 A (MIIB or MLC-DD top panels), showing a PI <1.5 and a flat or nonextended rear; “tailed” are cells with a P.I >1.5 and that show an extended rear or tail similar to the one shown in Fig. 4 A (bottom panels). Data are the mean ± SD of >300 cells per condition in two independent experiments. *, Student's t test of MLC-DD+MIIB vs. untransfected/MIIB alone.
Figure 6.
Figure 6.
The differential location of MIIA and MIIB assembly determines their subcellular localization. (MIIA) Time-lapse sequence of a migrating CHO.K1 cell transfected with GFP-MIIA. Bar, 5 μm. Arrowheads point to representative MIIA filaments as they form. These panels correspond to Video 3 (available at http://www.jcb.org/cgi/content/full/jcb.200806030/DC1). (MIIB) Time-lapse sequence of a migrating CHO.K1 cell transfected with GFP-MIIB. Time is in minutes. Bar, 5 μm. These panels correspond to Video 4 (available at http://www.jcb.org/cgi/content/full/jcb.200806030/DC1).
Figure 7.
Figure 7.
MLC-DD specifically inhibits the rate of MIIB exchange from actomyosin filaments. FRAP curves of MIIA (A) and MIIB (B) in thick actomyosin filaments, in the presence of the indicated mutants of MLC. Data are the mean ± SE of 24 individual measurements per condition in four independent experiments.
Figure 8.
Figure 8.
The tail domain of the myosin IIA and IIB heavy chain isoforms determines the subcellular localization, polarity phenotype, and exchange rate. (A) Cartoon depicting the domain swaps of MIIA and MIIB. Motor domains are represented in red, coiled-coil domains in blue. Unique sites used for PCR-based cloning are also shown. (B) Localization of MIIA, MIIB, and the two chimeras MIIA/B and MIIB/A. α-Actinin is used to locate the front and is shown in magenta in the colocalization panels; the myosin constructs are in green. Insets, detail of the localization of the myosin constructs in protruding areas. Note the absence of MIIB and MIIA/B in protrusions. Bar, 10 μm. (C and D) FRAP curves of MIIB/A (C) and MIIA/B (D). Average FRAP curves of wild-type MIIA and MIIB are also shown for comparison. Data are the mean ± SE of 24 individual measurements per condition in four independent experiments.
Figure 9.
Figure 9.
Differential rescue of the MIIB-induced polarity defect by the domain swap chimeras. MIIB knockdown cells were rescued with the indicated myosin II chimeras and plated on fibronectin. The polarity index of CHO.K1 cells was calculated as in Fig. 4. Data represent the mean ± SD of >100 cells analyzed per condition in four independent experiments. Bar, 10 μm. *, Student's t test of MLC-DD+GFP-MIIB/A vs. rescue with MIIB.
Figure 10.
Figure 10.
The tail domain of the myosin IIA and IIB heavy chain isoforms dictates their role in adhesion dynamics. Time-lapse sequence of protruding regions of MIIA-deficient CHO.K1 cells expressing paxillin-mOrange together with GFP-MIIA/B (A) or GFP-MIIB/A (B). Bar, 5 μm. Note the formation of elongated adhesions within the protrusion in B, marked by arrowheads, whereas the equivalent region in A remains almost devoid of large adhesions.

References

    1. Bao, J., S.S. Jana, and R.S. Adelstein. 2005. Vertebrate nonmuscle myosin II isoforms rescue small interfering RNA-induced defects in COS-7 cell cytokinesis. J. Biol. Chem. 280:19594–19599. - PubMed
    1. Burridge, K., and M. Chrzanowska-Wodnicka. 1996. Focal adhesions, contractility, and signaling. Annu. Rev. Cell Dev. Biol. 12:463–518. - PubMed
    1. Chew, T.L., W.A. Wolf, P.J. Gallagher, F. Matsumura, and R.L. Chisholm. 2002. A fluorescent resonant energy transfer-based biosensor reveals transient and regional myosin light chain kinase activation in lamella and cleavage furrows. J. Cell Biol. 156:543–553. - PMC - PubMed
    1. Choi, C.K., M. Vicente-Manzanares, J. Zareno, L.A. Whitmore, A. Mogilner, and A.R. Horwitz. 2008. Actin and [alpha]-actinin orchestrate the assembly and maturation of nascent adhesions in a myosin II motor-independent manner. Nat. Cell Biol. 10:1039–1050. - PMC - PubMed
    1. Chrzanowska-Wodnicka, M., and K. Burridge. 1996. Rho-stimulated contractility drives the formation of stress fibers and focal adhesions. J. Cell Biol. 133:1403–1415. - PMC - PubMed

Publication types