

Phylogenetic patterns of species loss in Thoreau's woods are driven by climate change
- PMID: 18955707
- PMCID: PMC2573948
- DOI: 10.1073/pnas.0806446105
Phylogenetic patterns of species loss in Thoreau's woods are driven by climate change
Abstract
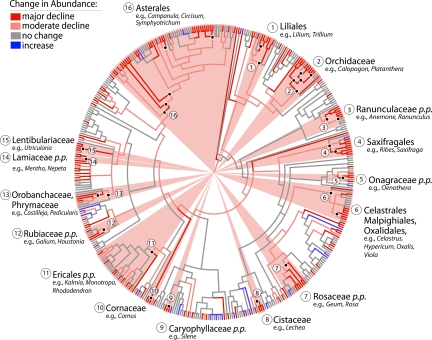
Climate change has led to major changes in the phenology (the timing of seasonal activities, such as flowering) of some species but not others. The extent to which flowering-time response to temperature is shared among closely related species might have important consequences for community-wide patterns of species loss under rapid climate change. Henry David Thoreau initiated a dataset of the Concord, Massachusetts, flora that spans approximately 150 years and provides information on changes in species abundance and flowering time. When these data are analyzed in a phylogenetic context, they indicate that change in abundance is strongly correlated with flowering-time response. Species that do not respond to temperature have decreased greatly in abundance, and include among others anemones and buttercups [Ranunculaceae pro parte (p.p.)], asters and campanulas (Asterales), bluets (Rubiaceae p.p.), bladderworts (Lentibulariaceae), dogwoods (Cornaceae), lilies (Liliales), mints (Lamiaceae p.p.), orchids (Orchidaceae), roses (Rosaceae p.p.), saxifrages (Saxifragales), and violets (Malpighiales). Because flowering-time response traits are shared among closely related species, our findings suggest that climate change has affected and will likely continue to shape the phylogenetically biased pattern of species loss in Thoreau's woods.
Conflict of interest statement
The authors declare no conflict of interest.
Figures
Comment in
-
An alternative to climate change for explaining species loss in Thoreau's woods.Proc Natl Acad Sci U S A. 2009 Mar 10;106(10):E28; author reply E29. doi: 10.1073/pnas.0811954106. Epub 2009 Mar 6. Proc Natl Acad Sci U S A. 2009. PMID: 19270076 Free PMC article. No abstract available.
References
-
- Sturm M, Racine C, Tape K. Climate change: Increasing shrub abundance in the Arctic. Nature. 2001;411:546–547. - PubMed
-
- Lenoir J, Gégout JC, Marquet PA, de Ruffray P, Brisse H. A significant upward shift in plant species optimum elevation during the 20th century. Science. 2008;320:1768–1771. - PubMed
-
- Menzel A, et al. European phenological response to climate change matches the warming pattern. Glob Change Biol. 2006;12:1969–1976.
-
- Bertin RI. Plant phenology and distribution in relation to recent climate change. J Torrey Bot Soc. 2008;135:126–146.
Publication types
MeSH terms
LinkOut - more resources
Full Text Sources
Other Literature Sources
