

Model-guided design of ligand-regulated RNAi for programmable control of gene expression
- PMID: 18956013
- PMCID: PMC2583087
- DOI: 10.1038/msb.2008.62
Model-guided design of ligand-regulated RNAi for programmable control of gene expression
Abstract
Progress in constructing biological networks will rely on the development of more advanced components that can be predictably modified to yield optimal system performance. We have engineered an RNA-based platform, which we call an shRNA switch, that provides for integrated ligand control of RNA interference (RNAi) by modular coupling of an aptamer, competing strand, and small hairpin (sh)RNA stem into a single component that links ligand concentration and target gene expression levels. A combined experimental and mathematical modelling approach identified multiple tuning strategies and moves towards a predictable framework for the forward design of shRNA switches. The utility of our platform is highlighted by the demonstration of fine-tuning, multi-input control, and model-guided design of shRNA switches with an optimized dynamic range. Thus, shRNA switches can serve as an advanced component for the construction of complex biological systems and offer a controlled means of activating RNAi in disease therapeutics.
Conflict of interest statement
The authors declare competing financial interests in the form of a pending patent application.
Figures

 ), increased (
 ), or decreased (
 ) cleavage in the presence of theophylline are shown. (C) Sequence and representative structure of shRNA switch S1 in the inactive conformation and associated controls. (D) Component transfer functions of S1 and switch controls. Dependence of GFP levels on theophylline concentration for HEK293T tTA-d2EGFP cells transfected with plasmids harbouring the indicated constructs in the presence of varying theophylline concentrations. Median fluorescence values from flow cytometry analysis were normalized to that of untransfected cells in the same well. Error bars represent one s.d. from duplicate transfected wells.
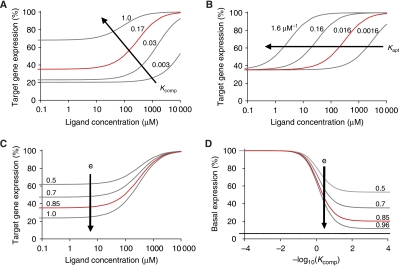
 ): Kcomp=0.17, Kapt=0.016 μM−1, e=0.85, fshRNA=0.94, and h=1.33.
 ) and reflect changes in Kcomp, and two strategies pertain to the aptamer domain (
 ) and reflect changes in Kapt and e. (B–G) Tuned theophylline response curves as described in Figure 1D and associated RNA sequences. Each family of curves represents iterative nucleotide modifications under a single tuning strategy within the competing strand: 3′-end (B), 5′-end (D), and complementarity to the shRNA stem (F). Indicated sequence variants are swapped into the equivalent box in (A), which designates the applied tuning strategy for each family of curves. Error bars represent one s.d. from duplicate transfected wells.

 ) and X1 (
 ), respectively. (E) Combinatorial implementation of shRNA switches enables construction of networks that process multiple molecular inputs. Results are shown for HEK293T tTA-d2EGFP cells transfected with each shRNA construct (250 ng) or cotransfected with both shRNA constructs (125 ng of each) in the presence of water (▪), 3 mM theophylline (
 ), 2 mM hypoxanthine (
 ), or both theophylline and hypoxanthine (□). Error bars represent one s.d. from duplicate transfected wells.
 ; e=0.85, Kapt=0.016 μM−1), respectively. (E) Values of η for shRNA switches containing the larger theophylline aptamer (S1–10; ○) or the smaller theophylline aptamer (S11–25;
  ) as a function of ΔGmethod. Each data point represents one shRNA switch. S13 (the optimized shRNA switch) and S1 (the original shRNA switch) are marked. (F, G) Flow cytometry data for HEK293T tTA-d2EGFP cells transfected with S1 (F) or S13 (G) in the presence (
 ) or absence (
 ) of 3 mM theophylline. Histograms are included for the untransfected population of each switch in the absence of theophylline (
 ) or cells transfected with the original shRNA targeting EGFP in the absence of theophylline (—).
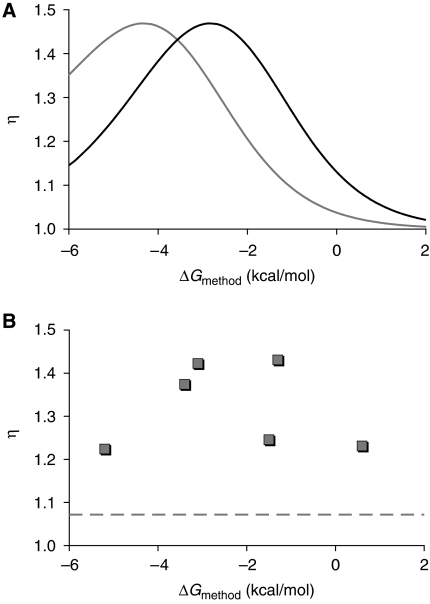
 ; fshRNA=0.6, e=0.72), or extrapolated empirical parameter values determined from the La switch experiments (—) (Supplementary Figure S8). (B) Relationship between ΔGmethod and experimental dynamic range (η) for La-targeting shRNA switches L1–6. Plasmids harbouring shRNA switches L1–6 displaying a range of ΔGmethod values were transiently transfected into HEK293T tTA-d2EGFP cells in the presence or absence of 1.5 mM theophyline and La mRNA levels were analysed by qRT–PCR (Supplementary Figure S8). Each data point represents one shRNA switch. The dashed line represents the apparent increase in La mRNA levels upon theophylline addition observed for the original shRNA (shL).
References
-
- Abbas-Terki T, Blanco-Bose W, Deglon N, Pralong W, Aebischer P (2002) Lentiviral-mediated RNA interference. Hum Gene Ther 13: 2197–2201 - PubMed
-
- Bayer TS, Smolke CD (2005) Programmable ligand-controlled riboregulators of eukaryotic gene expression. Nat Biotechnol 23: 337–343 - PubMed
-
- Berens C, Thain A, Schroeder R (2001) A tetracycline-binding RNA aptamer. Bioorg Med Chem 9: 2549–2556 - PubMed
Publication types
MeSH terms
Substances
LinkOut - more resources
Full Text Sources
Other Literature Sources
Molecular Biology Databases
Miscellaneous
