Review
. 2009 Mar-Apr;28(2):254-72.
doi: 10.1002/mas.20200.

On-line separations combined with MS for analysis of glycosaminoglycans

Affiliations
Review

On-line separations combined with MS for analysis of glycosaminoglycans

Joseph Zaia. Mass Spectrom Rev. 2009 Mar-Apr.

Abstract

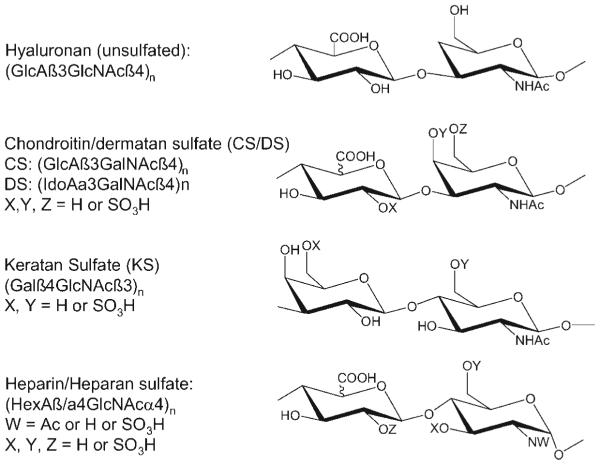
The glycosaminoglycan (GAG) family of polysaccharides includes the unsulfated hyaluronan and the sulfated heparin, heparan sulfate, keratan sulfate, and chondroitin/dermatan sulfate. GAGs are biosynthesized by a series of enzymes, the activities of which are controlled by complex factors. Animal cells alter their responses to different growth conditions by changing the structures of GAGs expressed on their cell surfaces and in extracellular matrices. Because this variation is a means whereby the functions of the limited number of protein gene products in animal genomes is elaborated, the phenotypic and functional assessment of GAG structures expressed spatially and temporally is an important goal in glycomics. On-line mass spectrometric separations are essential for successful determination of expression patterns for the GAG compound classes due to their inherent complexity and heterogeneity. Options include size exclusion, anion exchange, reversed phase, reversed phase ion pairing, hydrophilic interaction, and graphitized carbon chromatographic modes and capillary electrophoresis. This review summarizes the application of these approaches to on-line MS analysis of the GAG classes.


Figures

FIGURE 1
FIGURE 1
Repeating disaccharide structures for the glycosaminoglycans.
FIGURE 2
FIGURE 2
A: Photodiode array (PDA) chromatogram of tinzaparin recorded at 231–233 nm. B: ESI total ion chromatogram of tinzaparin. CH: Extracted ion traces corresponding to abundant GAGs with different degree of polymerization (dp). Mass spectra were summed within the 13 regions shown in (a–b). Compositions are given as (X, Y, Z) where X = number of monosaccharide units, Y = number of sulfate groups, and Z = number of acetyl groups (Henriksen, Ringborg, & Roepstorrf, 2004). © 2004 John Wiley and Sons, Limited. Reproduced with permission.
FIGURE 3
FIGURE 3
Summed mass spectra from different regions in the TIC chromatogram shown in Figure 2 (Henriksen, Ringborg, & Roepstorrf, 2004). The components are categorized by (X, Y, Z), as defined in Figure 2 legend. © 2004 John Wiley and Sons, Limited. Reproduced with permission.
FIGURE 4
FIGURE 4
A: RPIP-HPLC separation of heparin oligosaccharides obtained from controlled (30%) heparinase depolymerization of bovine lung heparin. A total ion chromatogram using negative ESI-MS detection (upper trace) with peaks numbered and a UV chromatogram at 232 nm (lower trace) with degree of polymerization (dp) of peaks are shown. The inset shows the expanded view of both the total ion chromatogram and the UV chromatograms of higher oligosaccharides assigned to dp16 –dp28 by peak counting. Negative mode ESI mass spectra of the fully sulfated heparin oligosaccharides ranging in size from disaccharide (dp2, B), hexasaccharide (dp6, C) to tetradecasaccharide (dp14, D). The full scan spectra (upper panel) and narrow range spectra showing isotope distribution (lower panel) are presented for the oligosaccharides of dp2–dp6 (Thanawiroon et al., 2004). © 2004 The American Society for Biochemistry and Molecular Biology, Inc., Reproduced with permission.
FIGURE 5
FIGURE 5
A: Amide-HILIC base peak mass-chromatogram (100–800 m/z) of 30% chondroitin lyase depolymerized CS/DS from juvenile bovine cartilage. GAG oligosaccharide chains ranging from disaccharide to dodecasaccharide elute from 15 to 55 min. Oligosaccharide compositions are given as (HexA, GalNAc, SO3) (X, Y, Z), with 4,5-unsaturation of HexA shown as Δ B: The extracted mass spectrum of all eluted oligosaccharides in the sample mixture. Label of tris indicates reductive amination product with tris buffer (Hitchcock, Costello, & Zaia, 2008). © 2008 Wiley-VCH Verlag GmbH & Co. KGaA, Weinheim. Reproduced with permission.
FIGURE 6
FIGURE 6
Representative MRM chromatogram of (1) Galb4GlcNAc(6S) and (2)Gal(6S)b4GlcNAc(6S) obtained by keratanase II digestion of (A) bovine cornea, (B) bovine nasal cartilage, (C) mouse brain, and (D) rat brain by turbo-ionspray LC-MS/MS using precursor ion m/z 462.0 and product ion m/z 96.8 (Oguma et al., 2001a). © 2001 Elsevier Limited. Reproduced with permission.
FIGURE 7
FIGURE 7
Separation and detection of heparan disaccharides (100 ng each) using negative ion graphitized carbon LC–MS. Panes (A–F) include base peak chromatogram and single ion chromatograms (SIC) of detected [M – H] ions. Structures assigned with an asterisk (*) indicate that these structures were detected in these SIC due to in-source fragmentation with loss of sulfate (S) as [M – H – S] ions (Karlsson et al., 2005). © 2005 Elsevier Limited. Reproduced with permission.
FIGURE 8
FIGURE 8
LC–MS (base peak chromatogram) of keratanase digested keratan sulphate (1 μg) from bovine cornea with detected structures. Sulfate is abbreviated as S (Karlsson et al., 2005). © 2005 Elsevier Limited. Reproduced with permission.

References

    1. Adamson JT, Hakansson K. Electron detachment dissociation of neutral and sialylated oligosaccharides. J Am Soc Mass Spectrom. 2007;18:2162–2172. - PubMed
    1. Akiyama H, Shidawara S, Mada A, Toyoda H, Toida T, Imanari T. Chemiluminescence high-performance liquid-chromatography for the determination of hyaluronic-acid, chondroitin sulfate and dermatan sulfate. J Chromatogr-Biomed Appl. 1992;579:203–207. - PubMed
    1. al-Hakim A, Linhardt RJ. Capillary electrophoresis for the analysis of chondroitin sulfate- and dermatan sulfate-derived disaccharides. Anal Biochem. 1991;195:68–73. - PubMed
    1. Alpert AJ. Hydrophilic-interaction chromatography for the separation of peptides, nucleic acids and other polar compounds. J Chromatogr. 1990;499:177. - PubMed
    1. Anumula KR. High-sensitivity and high-resolution methods for glycoprotein analysis. Anal Biochem. 2000;283:17–26. - PubMed

Publication types

MeSH terms

Substances

LinkOut - more resources