. 2008 Nov 25;47(47):12380-8.
doi: 10.1021/bi801470m.

Conformation and membrane position of the region linking the two C2 domains in synaptotagmin 1 by site-directed spin labeling

Affiliations

Conformation and membrane position of the region linking the two C2 domains in synaptotagmin 1 by site-directed spin labeling

Hao Huang et al. Biochemistry. .

Abstract

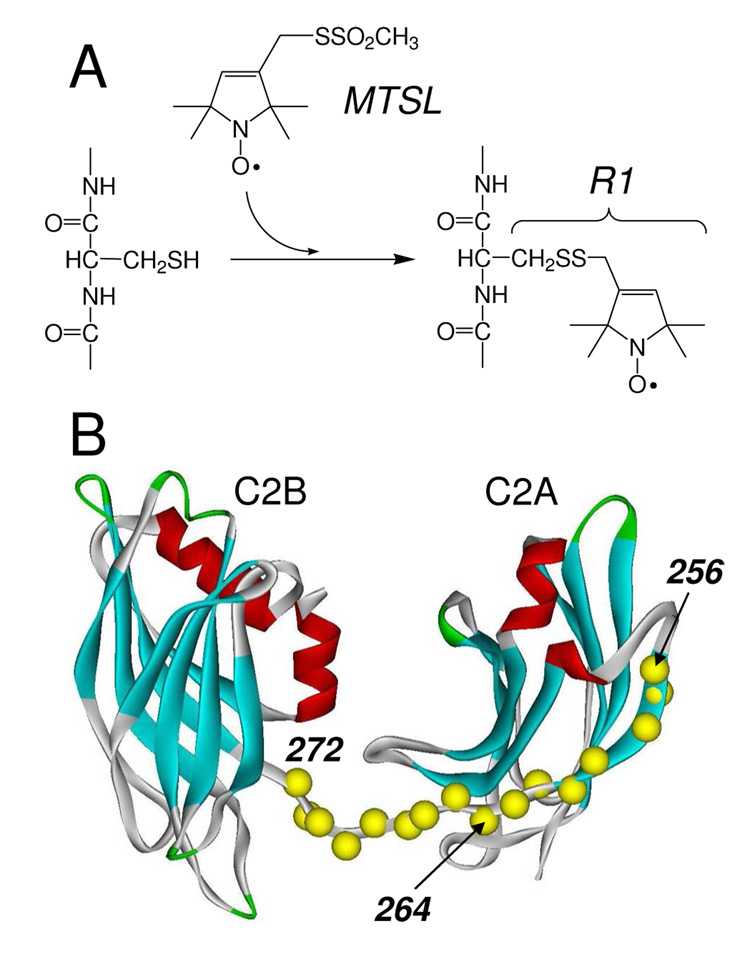
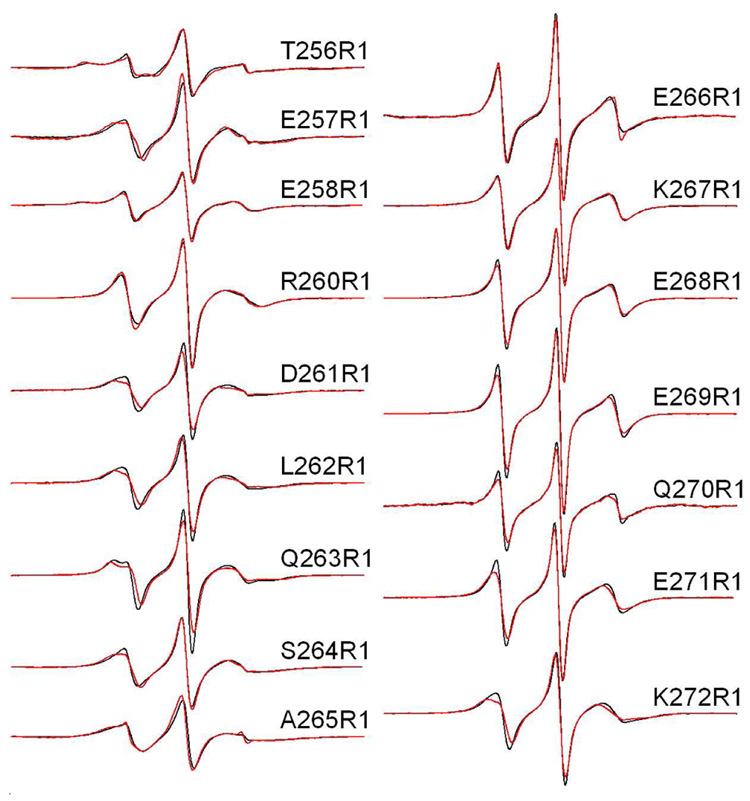
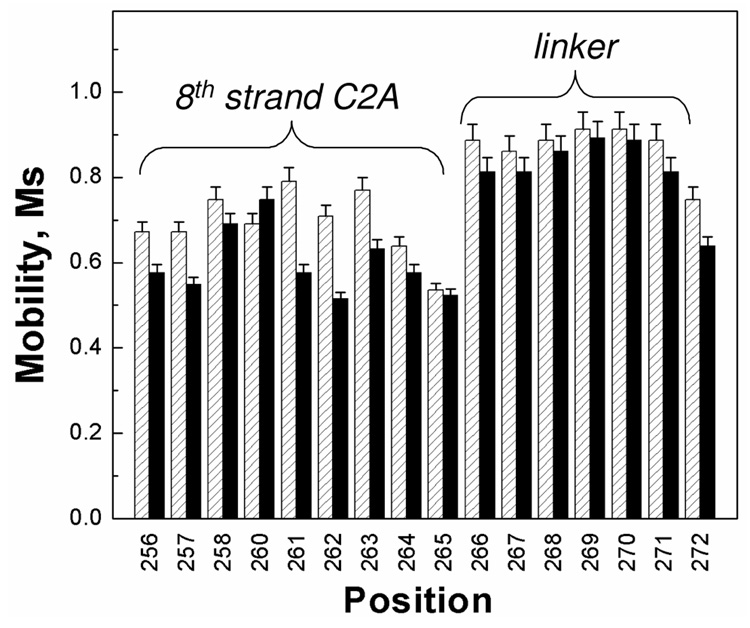
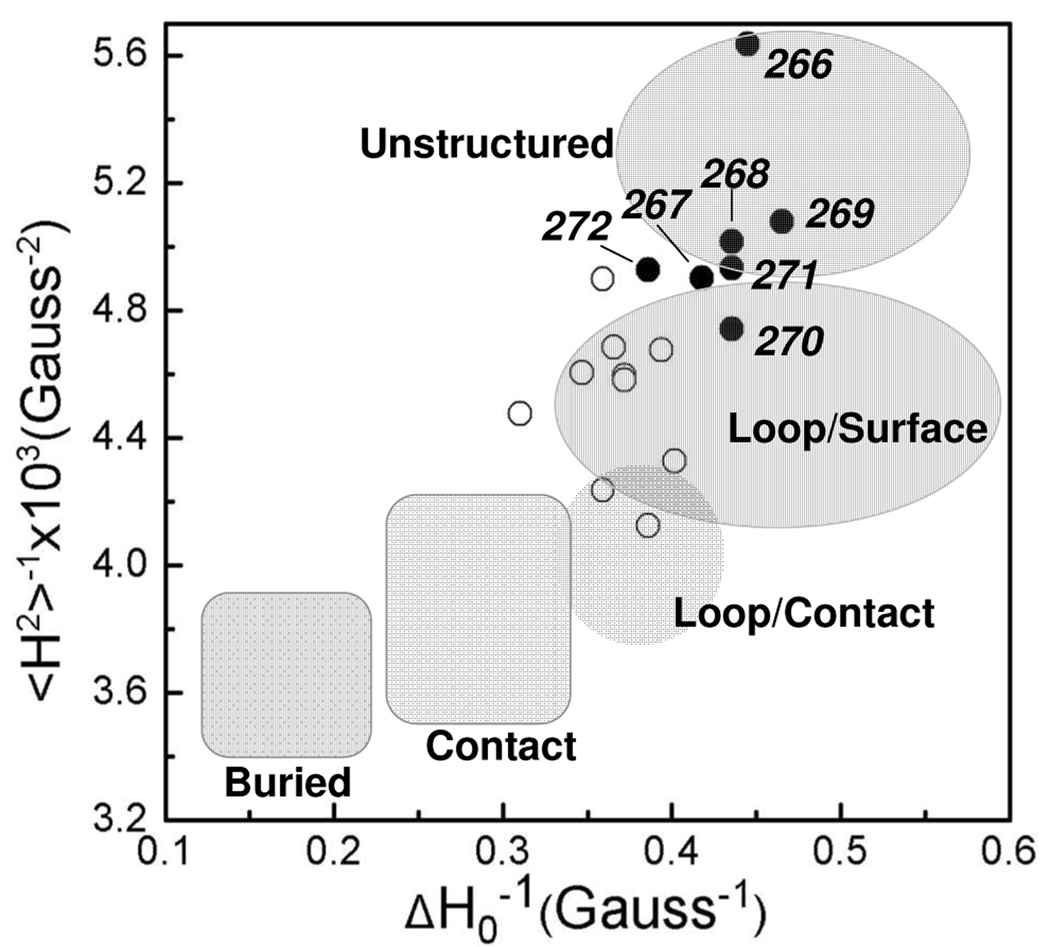
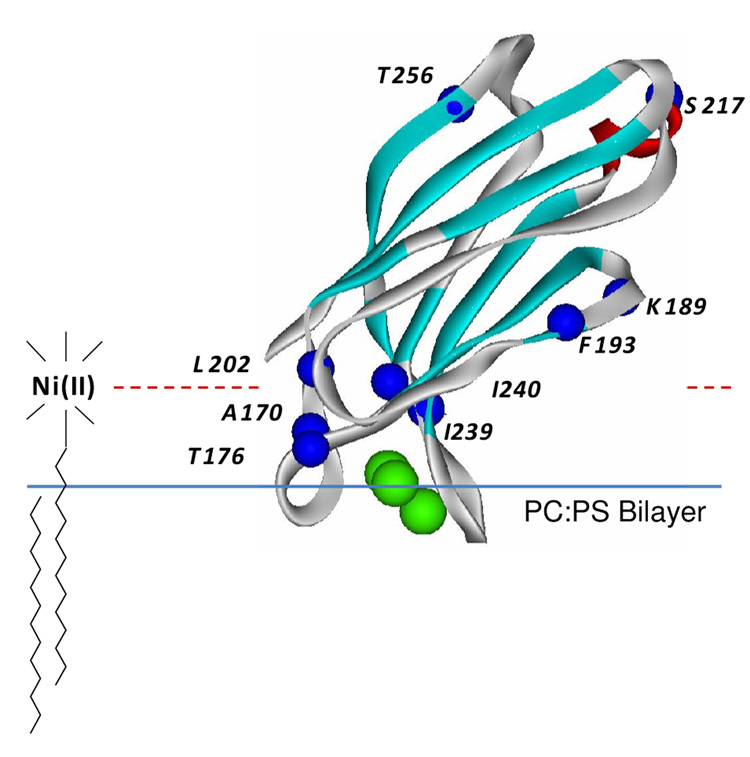
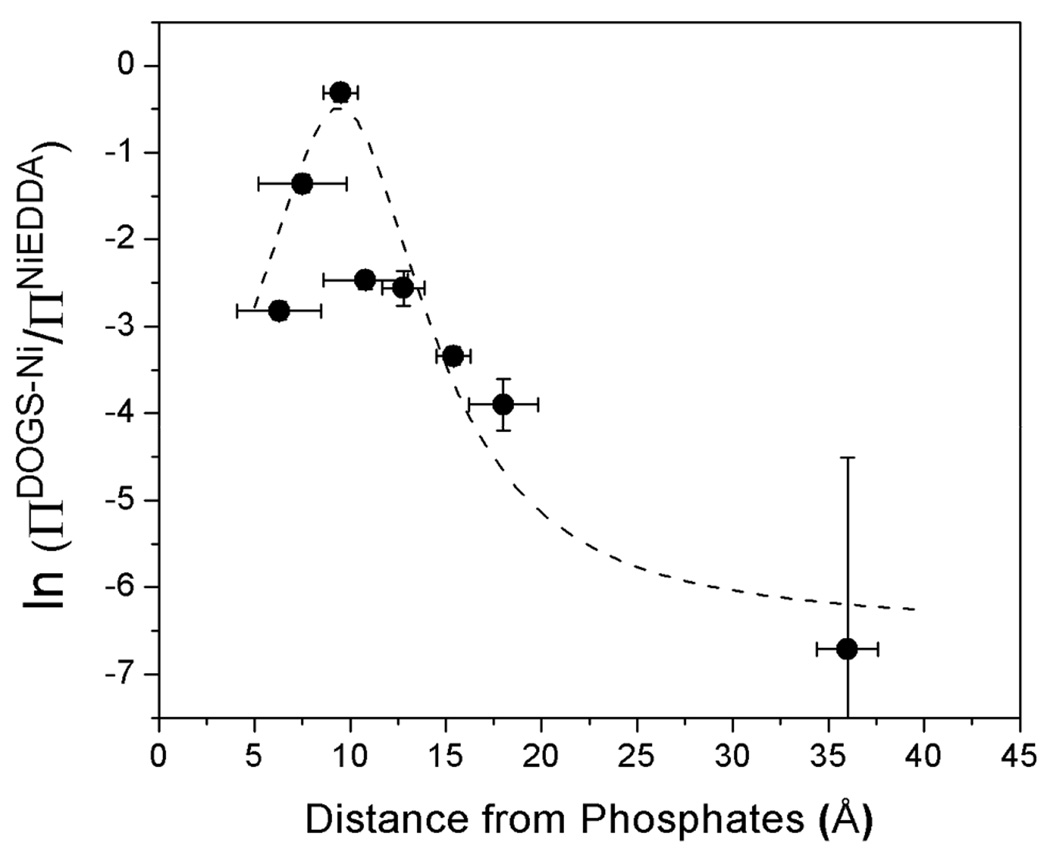
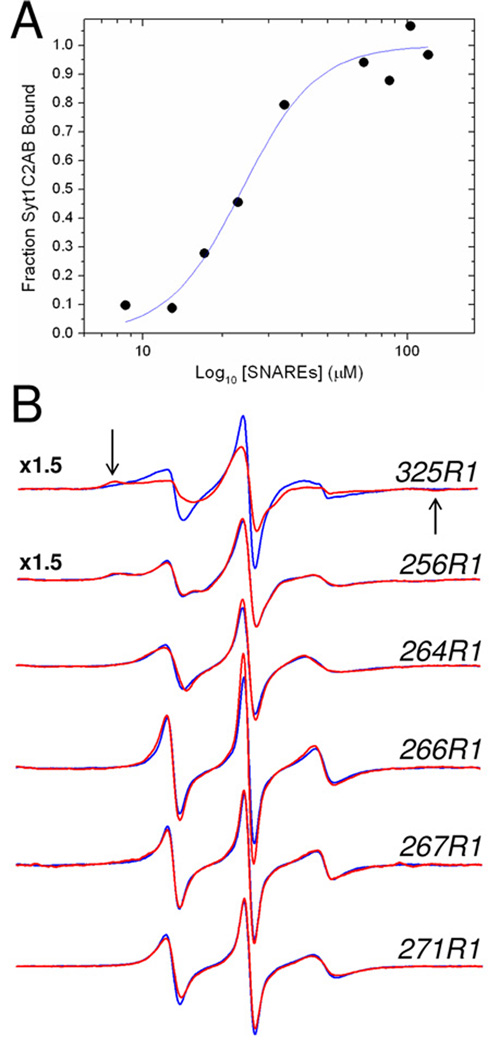
Synaptotagmin 1 (syt1) is an integral membrane protein localized on the synaptic vesicle that acts as the Ca(2+) sensor for neuronal exocytosis. Synaptotagmin 1 contains two C2 domains, C2A and C2B, which bind Ca(2+) ions, membranes, and SNAREs. Here, site-directed spin labeling (SDSL) was used to determine the position and dynamics of the region that links the two C2 domains in a water soluble construct encompassing the two C2 domains (syt1C2AB). An analysis of the EPR line shapes from this region indicates that the linker is flexible and unstructured when syt1 is in solution or bound to lipid bilayers. The nanosecond dynamics of the linker does not change, in the presence or absence of Ca(2+), suggesting that there is no Ca(2+)-dependent intramolecular association between the two domains. When syt1C2AB is membrane-bound, the position of the linker relative to the membrane interface was determined by measuring parameters for the collision of the spin-labeled syt1C2AB mutants with both soluble and membrane-bound Ni(II) chelates. These data indicate that the linker does not penetrate the membrane surface but lies approximately 7-10 A from the bilayer surface. In addition, the linker remains flexible when syt1C2AB binds to the SNARE complex, indicating that direct interactions between this linker and the SNAREs do not mediate association. These data suggest that the two C2 domains of syt1 interact independently on the membrane interface, or when bound to SNAREs.


Figures

Figure 1
Figure 1
A) The spin-labeled side-chain R1 is incorporated into syt1C2AB by derivatizing cysteine mutants with the MTSL. B) Model of a soluble portion of synaptotagmin 1 encompassing the two C2 domains. The first domain, C2A includes residues 140–263; the second, C2B, includes 273–418. The segment linking the two domains is formed from 264–272. Here, 16 single Cysteine mutants of a soluble fragment of syt1 (96–421) were produced (Cα positions in yellow). The C2AB model shown was built from models for the isolated C2A(PDB:1BYN) and C2B(PDB:1K5W) domains, that were connected with a linker using InsightII.
Figure 2
Figure 2
X-band EPR spectra of single R1 substitutions in C2AB in the presence of Ca2+. Aqueous spectra are shown in black, spectra of C2AB completely bound to POPC:POPS (75:25) vesicles are shown in red. Spin-labeled mutants within the linker encompass residues 264–272 and mutants 256–263 cover the last β-strand in C2A. The spectra are normalized relative to each other, and the relative amplitudes provide an indication of relative nitroxide motion. The spectra are 100 Gauss scans. The spin-labeled protein concentrations in these experiments was 50 µM, with lipid concentrations of approximately 1000 fold higher (50 mM or greater). This lipid concentration is well in excess of that needed to completely bind syt1C2AB as shown previously (11).
Figure 3
Figure 3
The scaled mobilities, Ms, for the spin-labeled sites within syt1C2AB that are located in the linker region or in the 8th β-strand of C2A. Values of Ms were calculated from the central linewidth of the EPR spectrum using Eq. 1. Aqueous values are shown in gray, values for syt1C2AB bound to POPC:POPS (75:25) vesicles are shown in black. When bound to lipid bilayers, there is a small decrease in the scaled mobility at some sites. Some of this decrease is likely due to a decrease in protein rotation and attachment of C2A and C2B upon membrane binding. Several sites show larger changes upon binding, which may indicate changes in local structure or dynamics upon membrane association (see text).
Figure 4
Figure 4
Plot of the reciprocal of the central linewidth (ΔH0−1) versus the reciprocal of the second moment (<H2>−1) of the EPR spectrum for the labeled sites in syt1C2AB. Residues that make up the flexible portion of the linker, 266–272, are plotted with solid circles. The open circles represent sites outside the linker and in the 8th β-strand of C2A. Many sites within the linker have spectral characteristics of an unstructured protein segment; other sites in the linker resemble those in very dynamic loop segments. The shaded areas correspond to those defined previously, based upon EPR lineshapes from R1 at sites in proteins of known structure (42).
Figure 5
Figure 5
High resolution model for syt1C2A (PDB 1BYN) (15). The domain is shown bound to bilayers composed of POPC:POPS with a depth of penetration and orientation that were previously determined from SDSL (28). This structure was used to calibrate the position parameter Φ2 as described in Methods. This parameter is expected to be sensitive to the position of the label on the aqueous side of the bilayer interface and utilizes the lipid bound nickel chelate, DOGS-NTA-Ni(II). Single cysteine mutants were generated at the indicated residues (Cα carbons highlighted in blue) to incorporate a series of R1 labels (see Fig. 1A) at varied positions off the bilayer interface.
Figure 6
Figure 6
The correlation of the position or depth parameter Φ2 at sites on syt1C2A as a function of distance from the membrane surface. The parameter Φ2 was determined using ΔP1/2 values for Ni(II)EDDA and DOGS-NTA-Ni(II) as given in Eq. 3. The distances of the R1 label on C2A were extracted from a model for membrane bound syt1C2A (28) using the procedure described in Methods. The dashed line shows is a Lorentzian centered around 9.5 Å.
Figure 7
Figure 7
A) Titration of the fraction of syt1C2AB bound to SNAREs as a function of the concentration of added soluble SNARE complex. The fraction of bound label was determined using Eq. 4. The fit to the data was made using a standard Hill Equation, and yield an affinity of 24 µM. A slight apparent cooperativity is found in this binding with n=2. In this titration, the concentration of syt1C2AB was held constant at 23 µM with a Ca2+ concentration of 1 mM. B) EPR spectra of single R1 substitutions in the absence (blue trace) or presence (red trace) of 120 M SNARE complex in the presence of 1 mM Ca2+. Site 325 is located in the C2B domain and is likely at a site that is involved in tertiary contact with the SNAREs. The arrows indicate the position of the hyperfine extrema in this spectrum. Site 256 lies within the 8th β-strand in the C2A domain, and sites 264, 266, 267 and 271 lie within the linker connecting C2A and C2B. The amplitudes of these EPR spectra are normalized against the second integral of the EPR spectrum and are expanded by a factor of 1.5 for 325R1 and 256R1.

References

    1. Jahn R, Lang T, Suhof TC. Membrane Fusion. Cell. 2003;112:519–533. - PubMed
    1. Rothman JE. Mechanisms of intracellular protein transport. Nature. 1994;372:55–63. - PubMed
    1. Sudhof TC. The synaptic vesicle cycle. Annual Review of Neuroscience. 2004;27:509–547. - PubMed
    1. Koh TW, Bellen HJ. Synaptotagmin I, a Ca2+ sensor for neurotransmitter release. Trends in Neurosciences. 2003;26:413–422. - PubMed
    1. Rizo J, Chen X, Arac D. Unraveling the mechanisms of synaptotagmin and SNARE function in neurotransmitter release. Trends Cell Biol. 2006;16:339–350. - PubMed

Publication types