. 2008 Nov 25;47(47):12448-56.
doi: 10.1021/bi8014289.

Concerted but noncooperative activation of nucleotide and actuator domains of the Ca-ATPase upon calcium binding

Affiliations

Concerted but noncooperative activation of nucleotide and actuator domains of the Ca-ATPase upon calcium binding

Baowei Chen et al. Biochemistry. .

Abstract

Calcium-dependent domain movements of the actuator (A) and nucleotide (N) domains of the SERCA2a isoform of the Ca-ATPase were assessed using constructs containing engineered tetracysteine binding motifs, which were expressed in insect High-Five cells and subsequently labeled with the biarsenical fluorophore 4',5'-bis(1,3,2-dithioarsolan-2-yl)fluorescein (FlAsH-EDT(2)). Maximum catalytic function is retained in microsomes isolated from High-Five cells and labeled with FlAsH-EDT(2). Distance measurements using the nucleotide analog 2',3'-O-(2,4,6-trinitrophenyl) adenosine 5'-triphosphate (TNP-ATP), which acts as a fluorescence resonance energy transfer (FRET) acceptor from FlAsH, identify a 2.4 A increase in the spatial separation between the N- and A-domains induced by high-affinity calcium binding; this structural change is comparable to that observed in crystal structures. No significant distance changes occur across the N-domain between FlAsH and TNP-ATP, indicating that calcium activation induces rigid body domain movements rather than intradomain conformational changes. Calcium-dependent decreases in the fluorescence of FlAsH bound, respectively, to either the N- or A-domains indicate coordinated and noncooperative domain movements, where both A- and N-domains display virtually identical calcium dependencies (i.e., K(d) = 4.8 +/- 0.4 microM). We suggest that occupancy of a single high-affinity calcium binding site induces the rearrangement of the A- and N-domains of the Ca-ATPase to form an intermediate state, which facilitates phosphoenzyme formation from ATP upon occupancy of the second high-affinity calcium site.


Figures
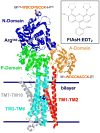
Figure 1
Figure 1. Locations of Engineered Labeling Motifs Within A- and N-domains of the Ca-ATPase
The headpiece corresponding to the A-domain (residues 1 to 43 and 124 to 235; orange), N-domain (residues 360 to 600; dark blue), and P-domain (residues 330 to 359 and 601 to 739; green) consists of three discrete structural elements relative to transmembrane helices TM1-TM2 (residues 44 to 123; red), TM3-TM6 (residues 239 to 329 and 740 to 821; cyan), and TM7-TM10 (residues 831 to 994; gray) (1su4.pdb), where domain boundaries are as previously described (7). Positions of FlAsH labeling are shown (CPK shaded side chains), and represent the insertion point corresponding to different constructs with either M1-WDCCKACCK-E2 on the A-domain or M575-WDCCPGCCK-H576 on the N-domain. Arg560 represents a reference point located in the nucleotide binding pocket, and acts to stabilize the alpha-phosphate of bound ATP (13). Inset shows structure of 4′,5′-bis(1,3,2-dithoarsolan-2-yl)fluorescein (FlAsH:EDT2).
Figure 2
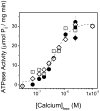
Figure 2. Catalytic Function of Wild-type and Engineered Constructs of the Ca-ATPase
Rates of ATP hydrolysis were measured for the Ca-ATPase in High-Five insect cell microsomes (50 μg/mL) expressing wild-type rat SERCA2a (●) or engineered constructs with tetracysteine insertion sequences in the A- (◇, ◆) or N-domain (□, ■) of the Ca-ATPase prior to (◇, □) or following (◆, ■) incubation with FlAsH:EDT2. ATPase activity was measured at 37 °C in 50 mM MOPS (pH 7.0), 0.1 M KCl, 3 mM MgCl2, 1 mM EGTA, and sufficient CaCl2 to yield the desired ionized calcium concentration, as previously determined (25). The reaction was initiated upon addition of 5 mM MgATP. The dotted line represents the fit to the Hill equation, where n = 1.6 ± 0.2 and Kd = 0.47 ± 0.05 μM free calcium. Maximal ATPase activities were normalized to the abundance of SERCA2a, where quantitative immunoblotting indicates that the Ca-ATPase represents on average about 1.5% of the total protein in isolated microsomes.
Figure 3
Figure 3. Selective Labeling of the Ca-ATPase Expressed in High-Five Microsomes
(Panel A) Fluorescence signals from FlAsH-labeled proteins following SDS-PAGE separation of microsomal proteins (40 μg) expressing wild-type SERCA2a (lane 1) or engineered constructs containing insertion sequences in the A-domain (lane 2) or N-domain (lane 3) assayed immediately after incubation with FlAsH:EDT2 (5 μM) for 10 minutes at 25 °C in the presence of 5 mM β-ME and 5 mM TCEP and the indicated amount of 2,3-dimercapto-1-propanesulfonic acid (DMPS) to reduce nonspecific binding (18). (Panel B) Coomassie blue protein stain (left lanes) or fluorescence (right lanes) imaging following FlAsH labeling, incubation in DMPS (50 μM), and SDS-PAGE separation of High-Five insect cell microsomes (10 μg) expressing engineered SERCA2a, where the insertion sequence is within the A- (WDCCKACCK) or N-domain (WDCCPGCCK) of the Ca-ATPase. (Panel C) Fluorescence emission spectra of High-Five insect microsomes (0.1 mg/mL) expressing either wild-type SERCA (dashed line) or the engineered N-domain tag (solid line) following incubation with FlAsH:EDT2 (10 μM), where λex = 500 nm. Fluorescence emission spectra of FlAsH-labeled vesicles expressing the A-domain tag were virtually identical to that shown using the N-domain tag.
Figure 4
Figure 4. Solvent Accessibilities of FlAsH bound to A-domain or N-domain of the Ca-ATPase
Stern-Volmer quenching was measured as decreases in the fluorescence intensity (F) relative to the initial value (Fo) for FlAsH-labeled microsomes expressing SERCA2a (50 μg/mL) in 150 mM MOPS (pH 7.0) and 5 mM MgCl2 in the presence of either 2 mM EGTA (●) or 0.2 mM CaCl2 (○) at 25 °C. Slopes of the lines (i.e., the Stern-Volmer quenching constant Ksv) for the A-domain are 0.49 ± 0.03 M−1 (EGTA) and 0.96 ± 0.05 M−1 (Ca2+); for the N-domain Ksv equals 0.56 ± 0.03 M−1 (EGTA) or 0.58 ± 0.04 M−1 (Ca2+). λex = 500 nm; λem = 530 nm.
Figure 5
Figure 5
Calcium-dependent Conformational Sensitivity of A-domain (panel A; ○ in panel C) or N-domain (panel B; ● in panel C) constructs of FlAsH-labeled SERCA2a (50 μg/mL) in 150 mM MOPS/TRIS (pH 7.0), 5 mM MgCl2, 0.5 mM EGTA, and sufficient calcium to yield the indicated ionized (free) calcium concentration. Values represent averages and standard errors of the mean from three independent measurements, where λex = 500 nm; λem = 530 nm. Line in panel C represents nonlinear least squares fit of both data sets to the Hill equation, where the macroscopic equilibrium constant Kd equals 0.48 ± 0.04 μM and the Hill coefficient is 0.93 ± 0.07. Temperature was 25 °C.
Figure 6
Figure 6. Calcium-Dependent Change in Spatial Separation Between A- and N-domains
Fluorescence resonance energy transfer efficiency (E) was measured using FlAsH (donor) bound to either the A-domain or N-domain and TNP-ATP (acceptor), where E = 1 − Fda/Fd. Fda and Fd are the fluorescence intensity of FlAsH bound donor prior to and following saturation of the ATP binding site by the nucleotide analog TNP-ATP. Experiments were carried out using FlAsH-labeled microsomes expressing SERCA2a (12 μg protein/mL) in 150 mM MOPS/TRIS (pH 7.0) in the presence of either 0.2 mM CaCl2 (○) or 2 mM EGTA (●). λex = 500 nm; λem = 530 nm, and fluorescence intensities were corrected for the inner filter effect (27). Lines represent fits to the Hill equation, where for the A-domain Kd is 13 ± 2 μM and Emax is 0.39 ± 0.03 in the presence of calcium (○) and Kd is 11 ± 2 μM and Emax is 0.47 ± 0.03 in the presence of EGTA (●). For the N-domain Kd is 11 ± 1 μM and Emax is 0.73 ± 0.05 for in the presence of calcium (○) and Kd is 9 ± 1 μM and Emax is 0.69 ± 0.05 in the presence of EGTA (●).
Figure 7
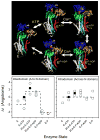
Figure 7. Headpiece Domain Reorientation and Calcium Activation
(Top Panel): Depiction of selected crystal structures of the Ca-ATPase (top), using domain boundaries defined in the legend to Figure 1. Coordinates were used for the Ca-ATPase (i.e., E) stabilized in six different states, corresponding to i) E, no calcium (1iwo.pdb; shown) (35), ii) E-ATP (2dqs.pdb and 2c88.pdb (shown))(22), iii) 2Ca-E-ATP (1vfp.pdb and 1t5s.pdb (shown))(7, 8), iv) 2Ca-E-P:ADP (2zbd.pdb, 1t5t.pdb (shown), or 3ba6.pdb)(3, 7, 48), v) E-P:ADP (3b9r.pdb or 1wpg.pdb (shown))(3, 48), and vi) E-P (3b9b.pdb and 1xp5.pdb)(3, 49). (Bottom Panels): Distance changes (Δr) between sites of FlAsH labeling site in the A-domain (i.e., interdomain spatial separation) or N-domain (intradomain spatial separation) relative to the nucleotide binding pocket in N-domain (i.e., NH1 sidechain of Arg560 that functions to coordinate binding of alpha-phosphate group of ATP (13)), using high-resolution structures of the Ca-ATPase stabilized in different enzymatic states (○) in comparison to experimental measurements using TNP-ATP as a FRET acceptor (●), normalized to an arbitrary reference point.
Figure 8
Figure 8. Calcium Occupancy and Concerted Structural Changes in Transmembrane and Cytosolic Headpiece Associated with Occupancy of Calcium Binding Site One and Enzyme Activation
Amino acids involved in calcium-dependent salt-bridges are highlighted in apo- (2c88.pdb) and calcium-activated (1t5s.pdb) forms of the Ca-ATPase. Arrows in 1t5s.pdb for the calcium-activated form highlight major calcium-dependent structural changes. Side chains associated with calcium binding to site one [involving ligands N768 and E771 in M5 (green), T799 and D800 in M6 (blue), and E908 in M8 (not shown)] induces M5 helix reorientation, bringing R762 (M5) into the proximity of D981 (M10 in red)) to form a stable salt bridge. Binding of the first calcium induces the formation of calcium binding site two (which shares calcium binding site N796 and D800 on M6) with concommitant reorientation of M4 to stabilize salt bridges i) E80 (M1/M2 loop) with R290 (M3/M4 loop) and ii) E90 in M2 (orange) with K297 in M4 (yellow) to form a helix bundle with the associated formation of the salt bridge between K47 and E243 located near the bilayer surface proximal to M1 (white) and M3 (cyan).

References

    1. Kuhlbrandt W. Biology, structure and mechanism of P-type ATPases. Nat Rev Mol Cell Biol. 2004;5:282–295. - PubMed
    1. Moller JV, Olesen C, Jensen AM, Nissen P. The structural basis for coupling of Ca2+ transport to ATP hydrolysis by the sarcoplasmic reticulum Ca2+-ATPase. J Bioenerg Biomembr. 2005;37:359–364. - PubMed
    1. Olesen C, Picard M, Winther AM, Gyrup C, Morth JP, Oxvig C, Moller JV, Nissen P. The structural basis of calcium transport by the calcium pump. Nature. 2007;450:1036–1042. - PubMed
    1. Toyoshima C. Structural aspects of ion pumping by Ca(2+)-ATPase of sarcoplasmic reticulum. Arch Biochem Biophys. 2008;476:3–11. - PubMed
    1. Toyoshima C, Inesi G. Structural basis of ion pumping by Ca2+-ATPase of the sarcoplasmic reticulum. Annu Rev Biochem. 2004;73:269–292. - PubMed

Publication types

MeSH terms

Substances