. 2008 Jul-Aug;15(4):268-76.
doi: 10.1111/j.1399-3089.2008.00480.x.

Proteomic identification of non-Gal antibody targets after pig-to-primate cardiac xenotransplantation

Affiliations

Proteomic identification of non-Gal antibody targets after pig-to-primate cardiac xenotransplantation

Guerard W Byrne et al. Xenotransplantation. 2008 Jul-Aug.

Abstract

Background: Experience with non-antigenic galactose alpha1,3 galactose (alphaGal) polymers and development of alphaGal deficient pigs has reduced or eliminated the significance of this antigen in xenograft rejection. Despite these advances, delayed xenograft rejection (DXR) continues to occur most likely due to antibody responses to non-Gal endothelial cell (EC) antigens.

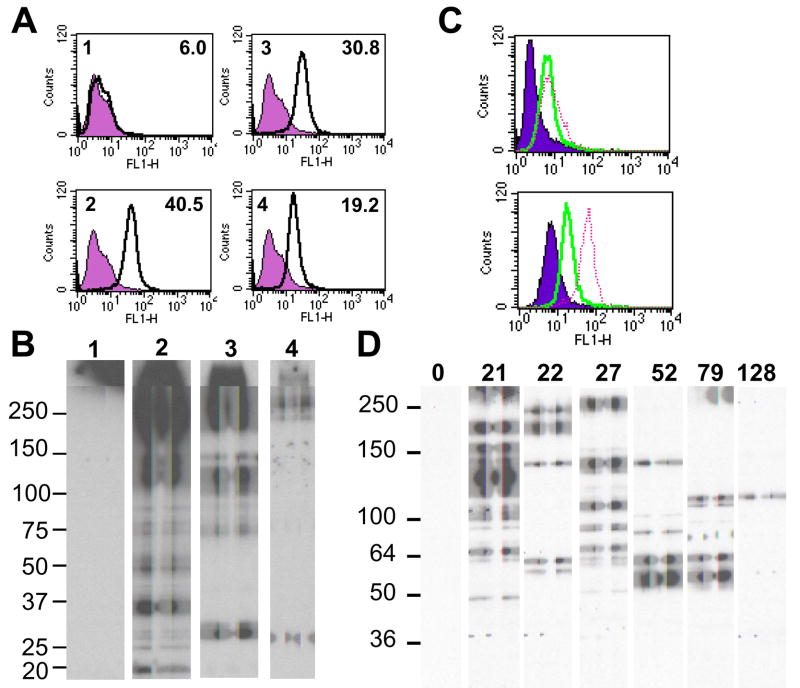
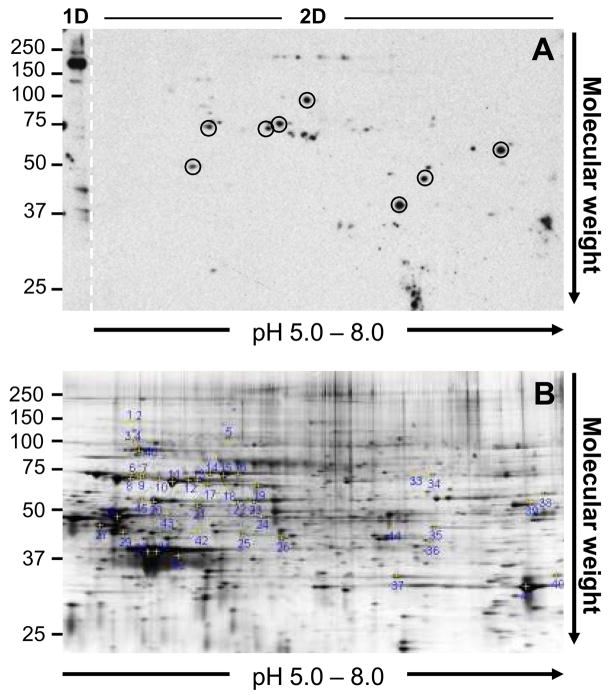
Methods: To gauge the diversity of the non-Gal antibody response we used antibody derived from CD46 transgenic heterotopic cardiac xenografts performed without T-cell immunosuppression, Group A (n = 4) and Gal knockout (GT-KO) heart transplants under tacrolimus and sirolimus immunosuppression, Group B (n = 8). Non-Gal antibody was measured by flow cytometry and by western blots using GT-KO EC membrane antigens. A nanoLC/MS/MS analysis of proteins recovered from 2D gels was used to identify target antigens.

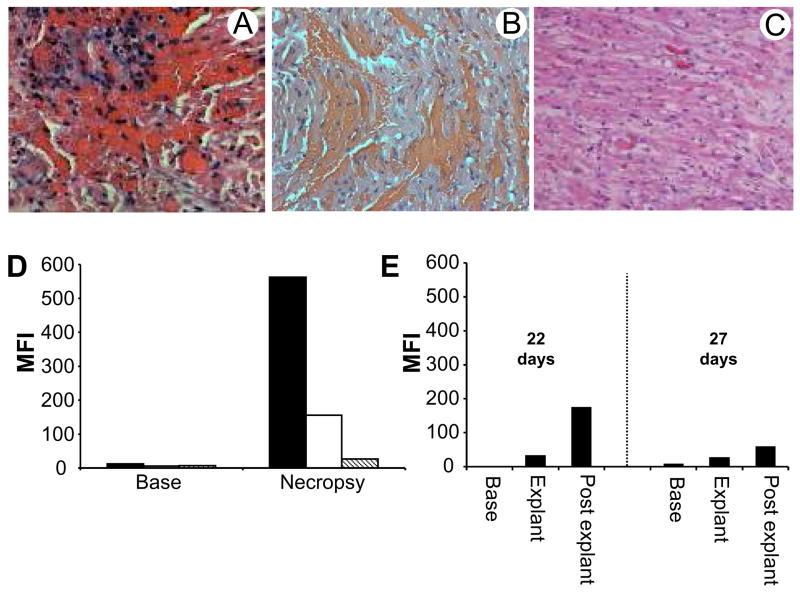
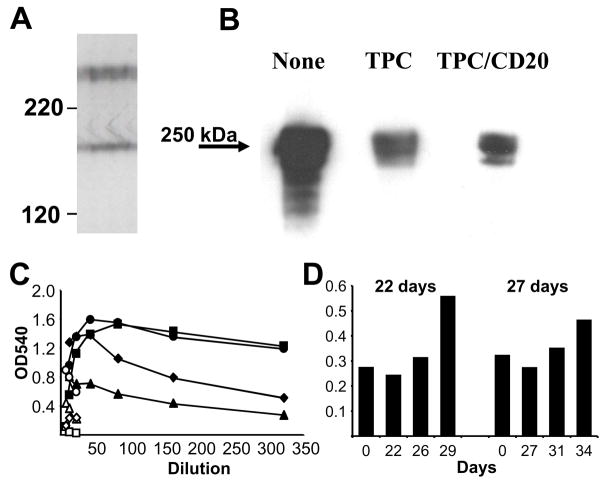
Results: Group A recipients exhibited a mixed cellular and humoral rejection. Group B recipients mainly exhibited classical DXR. Western blot analysis showed a non-Gal antibody response induced by GT+ and GT-KO hearts to an overlapping set of pig aortic EC membrane antigens. Proteomic analysis identified 14 potential target antigens but failed to define several immunodominant targets.

Conclusions: These experiments indicate that the non-Gal antibody response is directed to a number of stress response and inflammation related pig EC antigens and a few undefined targets. Further analysis of these antibody specificities using alternative methods is required to more fully define the repertoire of non-Gal antibody responses.


Figures

Figure 1
Figure 1
Histology and antibody responses after cardiac xenotransplantation. A. Representative histology of Group A rejected xenografts exhibiting florid intragraft cellular infiltration. B. Histology showing widespread hemorrhage of a GT-KO Group B xenograft rejected 90 minutes after reperfusion. C. Typical histology of Group B rejected xenografts showing microvascular thrombosis and myocardial ischemic injury. D. The graph shows mean fluorescence intensity of IgG staining on GT-KO PAECs stained with pretransplant (Base) and necropsy serum (Necropsy) from Group A recipients. No treatment (black), treated with TPC (white) and treated with TPC and Rituximab (striped). E. Graph shows mean fluorescence intensity of IgG binding to GT-KO PAEC after staining with pretransplant (base), explant and post explant serum from Group B recipients that rejected their grafts on days 22 and 27.
Figure 2
Figure 2
Specificity of induced anti-pig IgG. A. Flow cytometry measuring the binding of IgG purified from Group A necropsy serum to GT-KO PAECs. Upper left number in each panel indicates the source of the IgG and the number in the upper right is the mean fluorescence intensity. Specific binding is the dark line. Background binding (filled histogram) was determined using only the FITC conjugated secondary antibody. 1; IgG from a pool of naive baboon serum. 2 – 4; IgG purified from necropsy serum of recipients that received no treatment for antibody (2), TPC (3), or TPC and Rituximab (4). B. Western blot analysis of purified Group A IgG binding to GT-KO PAEC membrane antigens. Numbers of each lane indicate the source of IgG and correspond to FACS panels in A. C. Flow cytometry analysis of IgG binding to GT-KO PAECs using antibody recovered from rejected Group B xenografts. Xenograft rejected on day 52 (solid) and day 79 (dashed) are presented in the top panel and xenograft rejected on day 21 (solid) and day 27 (dashed) in the bottom panel. Background binding (filled) was determined using the FITC secondary antibody only. D. Western blot detection of recovered IgG binding to GT-KO PAEC membrane antigens. Duration of graft survival is indicated for each lane.
Figure 3
Figure 3
Proteomic analysis of non-Gal antigens. A. Representative 2D Western blot of Group A IgG binding to membrane enriched GT-KO PAEC antigens. The left edge of the gel (labeled 1D and demarcated with a dashed line) contains an individual lane of GT-KO PAEC membrane enriched antigens which were separated by molecular weight in one dimension only. The remainder of the gel (labeled 2D) is the second dimension separation of membrane enriched antigens after previous isoelectric focusing through a pH 5 – 8 IPG strip. The circled spots in the Western corresponded to immunoreactive spots which aligned with spots in the total protein gel and were excised for nanoLC/MS/MS peptide analysis. Note that the prominent immunoreactive band above 150kDa detected after separating membrane enriched proteins by molecular weight only (see 1D section) lacks a corresponding spot when the membrane enriched antigens are separated by both isoelectric focusing and molecular weight (see 2D section). B. A representative syproRed stained 2D gel showing total protein distribution and indicating the position of each spot recovered and analyzed in this study. The Western blot in A and the total protein gel in B are not matched.
Figure 4
Figure 4
Characterization of high molecular weight non-Gal antigens detected by Group A antibody. A. High resolution 1D Western blot of high molecular weight antigens detected by IgG purified from a TPC treated recipient. B. Western blot analysis of antibody eluted from Group A rejected xenograft binding to purified pig fibronectin (1 μg/lane) electrophoresed in a 5% denaturing acrylamide gel. The treatment for each recipient is presented above the lane. C. ELISA analysis of pretransplant (open symbols) and necropsy serum (closed symbols) of Group A IgG binding to porcine fibronectin. No treatment (circle), TPC treated (square and triangle), TPC and Rituximab treated (diamond). D. ELISA analysis of anti-fibronectin IgG activity in 2% serum from Group B recipients that survived explant. The x-axis indicates the transplant day for each serum sample and the explant day is indicated above each graph.

References

    1. LEVENTHAL JR, SAKIYALAK P, WITSON J, et al. The synergistic effect of combined antibody and complement depletion on discordant cardiac xenograft survival in nonhuman primates. Transplantation. 1993;57:974–978. - PubMed
    1. LIN SS, KOOYMAN DL, DANIELS LJ, et al. The role of natural anti-Gal-alpha-1-3Gal antibodies in hyperacute rejection of pig-to-baboon cardiac xenotransplants. Transplant Immunol. 1997;5:212–218. - PubMed
    1. LOGAN JS. Prospects for xenotransplantation. Curr Opin Immunol. 2000;12:563–568. - PubMed
    1. DORLING A. Are anti-endothelial cell antibodies a pre-requisite for the acute vascular rejection of xenografts? Xenotransplantation. 2003;10:16–23. - PubMed
    1. MCGREGOR CGA, TEOTIA SS, BYRNE GW, et al. Cardiac xenotransplantation: Progress toward the clinic. Transplantation. 2004;78:1569–1575. - PubMed

Publication types