. 2008 Oct 17;135(2):322-33.
doi: 10.1016/j.cell.2008.08.038.

Fibrils connect microtubule tips with kinetochores: a mechanism to couple tubulin dynamics to chromosome motion

Affiliations

Fibrils connect microtubule tips with kinetochores: a mechanism to couple tubulin dynamics to chromosome motion

J Richard McIntosh et al. Cell. .

Abstract

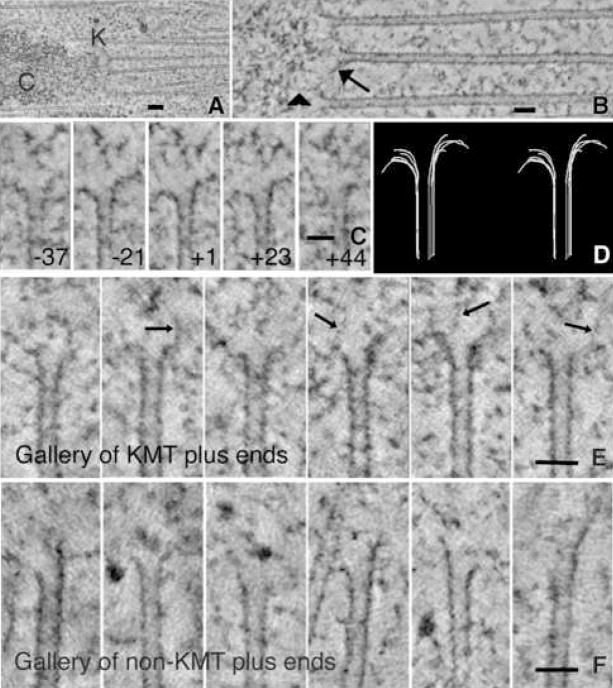
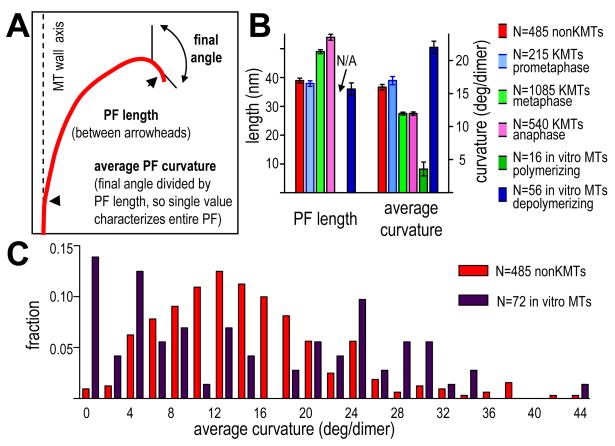
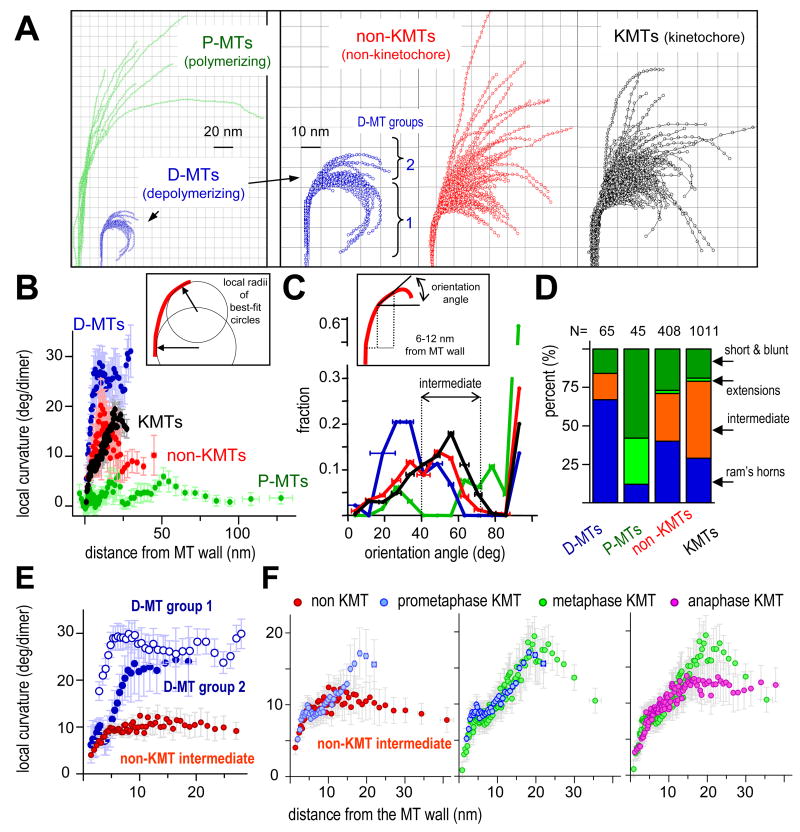
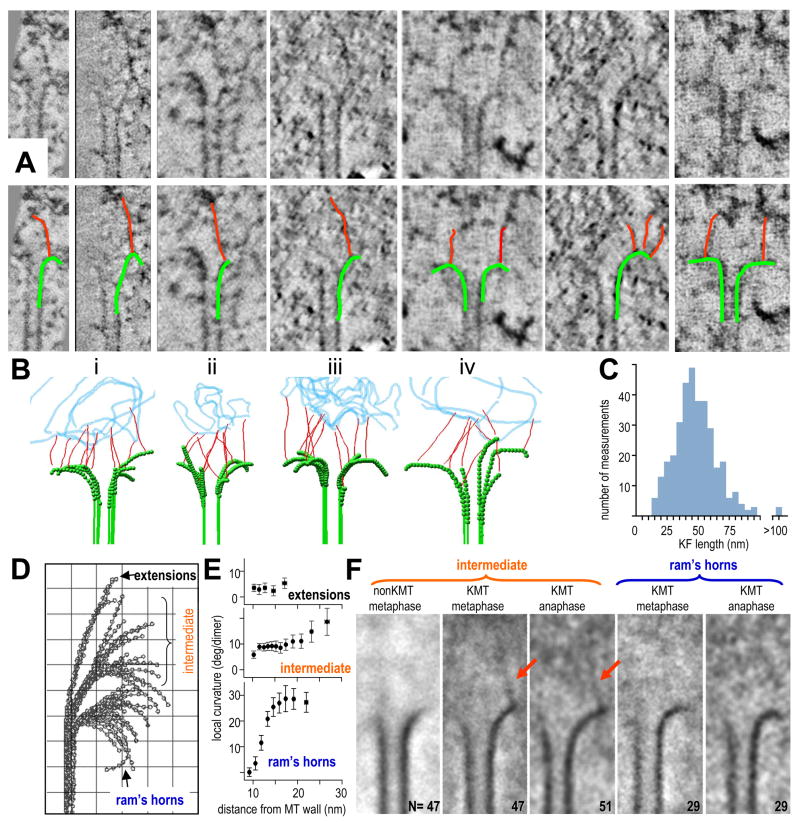
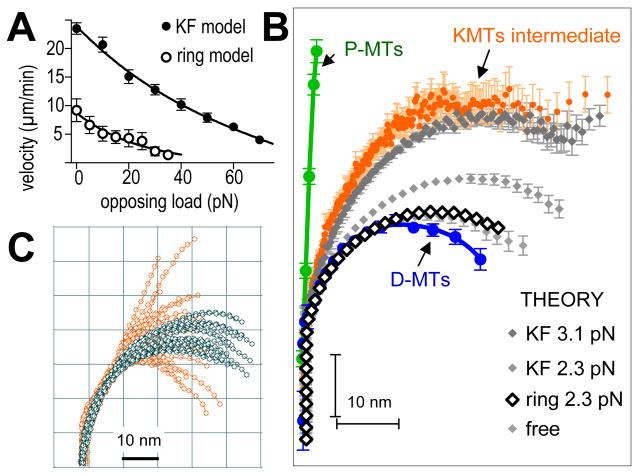
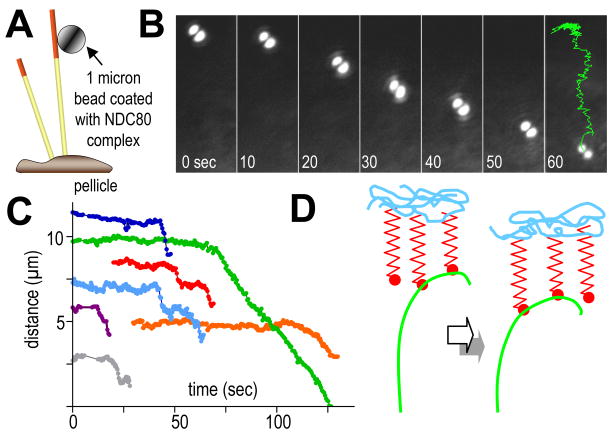
Kinetochores of mitotic chromosomes are coupled to spindle microtubules in ways that allow the energy from tubulin dynamics to drive chromosome motion. Most kinetochore-associated microtubule ends display curving "protofilaments," strands of tubulin dimers that bend away from the microtubule axis. Both a kinetochore "plate" and an encircling, ring-shaped protein complex have been proposed to link protofilament bending to poleward chromosome motion. Here we show by electron tomography that slender fibrils connect curved protofilaments directly to the inner kinetochore. Fibril-protofilament associations correlate with a local straightening of the flared protofilaments. Theoretical analysis reveals that protofilament-fibril connections would be efficient couplers for chromosome motion, and experimental work on two very different kinetochore components suggests that filamentous proteins can couple shortening microtubules to cargo movements. These analyses define a ring-independent mechanism for harnessing microtubule dynamics directly to chromosome movement.


Figures

Figure 1
Figure 1. Microtubules from mitotic PtK1 cells
A. Average of 15 consecutive tomographic slices, total thickness ~30 nm, analogous to a conventional thin section. Chromosome (C) and kinetochore (K) show characteristic staining. MTs were identified as KMTs when they ended in a cluster near a chromosome. Bar = 0.1μm. B. KMTs from the same cell but seen in a ~2 nm slice cut parallel to their axes with the “Slicer” feature of IMOD. Arrow identifies a bending PF; arrowhead indicates a fibril that runs from a PF to the chromatin. Bar = 0.05μm. C. Multiple image planes that contain the MT axis but are oriented at the angles stated relative to the plane of section; PFs in each view differ in length and extent of flare. Bar = 0.05μm. D. Stereo pair of a 3D model of all the PFs traced on the MT shown in Fig 1C. Use wall-eyed viewing. E. Gallery of different KMT ends from the same cell. PF flare is variable; fibrillar material is associated with some PFs (arrows). Bar = 0.05μm. F. Gallery of non-KMT ends from the polar region of a metaphase spindle; no chromosomes are near. Some MT ends are flared, others not; fibrils are not seen. Bar = 0.05μm.
Figure 2
Figure 2. Quantitative analysis of average PF shape
A. Diagram of a traced PF and the ways the howflared program identified its length, final angle, and average curvature. B. Average properties of PFs from non-KMTs, KMTs at several mitotic stages, and MTs in vitro. N=number of PFs for each MT class. N/A=not applicable. C. Histogram of average PF curvature for non-KMTs (red) and pooled samples of P- and D-MTs in vitro (dark red). N=number of PFs in each class.
Figure 3
Figure 3. Quantitative analysis of local PF shape
A. PFs from different MT ends: Polymerizing (green) and depolymerizing (blue) MTs formed from pure tubulin in vitro (Mandelkow et al., 1991). Non-KMT PFs (red) are from plus MT ends near the pole of a metaphase PtK1. KMT PFs (black) represented by ~25% of all metaphase and anaphase KMTs, selected at random. Scale for P-MTs is ½ that for other MT ends. PFs for D-MTs are shown at both scales for comparison. B. Determination and distributions of local curvatures. Box diagrams use of a running average of 10 consecutive points along a PF to determine best-fit circles. Graph displays local curvatures as functions of distance from the MT wall; colors as in A. Error bars here and on all graphs are SEMs. C. Assessing PF orientation. Box diagrams a strategy for measuring the orientation of PFs in any interval of distances from the MT wall. Graph shows normalized distributions of average PF orientations between 6 and 12 nm from the MT wall for four dataset, colors as in A. Error bars are SEMs of all PFs in that bin. Most P-PFs are nearly straight, so their greatest fraction is at about 90°, represented with a broken scale. D. PFs were sorted into four groups based on their orientation angles (see text). N is the number of PFs in each dataset. E. Mean local curvature as a function of distance from MT wall. PFs from D-MTs fall into two groups (3A). Different local curvature developments as a function of distance from MT wall are consistent with the model that some adjacent PFs adhere close to the wall (group 2). F. Mean local curvatures as a function of distance from MT wall for “intermediate” PFs from metaphase non-KMTs and KMTs from prometaphase, metaphase, and anaphase. The same data for non-KMT PFs are plotted on E and F, for easier comparison
Figure 4
Figure 4. Fibrils associate with PFs at places that correlate with changes in local PF curvature
A. Tomographic slices of KMT ends. The same gallery is also shown with PFs and their associated KFs indicated by graphic overlays. B. Models of metaphase (i,ii) and anaphase (iii,iv) KMT ends; PFs traced in green, KFs in red; a representation of chromatin is in blue. C. Histogram of KF lengths based on data from 40 KMTs chosen at random from 4 cells. D,E. PFs from all the KMTs reconstructed by electron tomography from one metaphase kinetochore. PFs were grouped by their orientation angles. Mean local curvatures of each group are plotted in (E). The intermediate group of PFs is conspicuous for its consistent local curvature near the MT wall and its curvature variation farther from the wall. Grid=10nm. F. Averages of multiple tomographic slices containing PFs from different groups (numbers as indicated). Alignments maximized overlap for the PFs curving right. Intermediate group PFs from metaphase non-KMTs average well, but no KF is evident. Intermediate group KMT PFs from one metaphase and one anaphase cell show 45 – 54 nm KFs, attached to the averaged PF and extending toward the chromatin. Averages of the ram’s-horn groups from metaphase and anaphase cells showed no additional electron density at PF tips.
Figure 5
Figure 5. PFs as mechanical elements that can do work as they bend
A. Force velocity curves for motions of various loads, due to shortening MTs acting through two types of couplers. Data for ring coupler is from (Efremov et al., 2007). B. Average PF shapes from P-MTs (N=45) or D-MTs (N=65) compared with the average shape of intermediate KMT PFs (N=505). Curves in different grays show theoretical PFs under various tensions applied by randomly attaching KFs. Bars are SEMs. PFs interacting with a Dam1-like ring (blue) are experiencing 2.3 pN/PF. Larger forces stall motion and induce ring detachment (A) (Efremov et al., 2007). C. Comparison of intermediate PFs from one metaphase kinetochore (orange, same set as Fig 4B) with a family of theoretical PFs (grey) under an average tension of 3.1 pN/PF. The model describes PF straightening close to the MT wall quite well, but the spread in the data farther from the wall indicates the presence of unidentified factors that modify these PF parts.
Figure 6
Figure 6. Beads coated with Ndc80 complex moving with depolymerizing MTs in vitro
A. Experimental design (not to scale). Bovine brain MTs were capped with GMPCPP-assembled, rhodamine-labeled tubulin, so they would break up upon illumination with green light, permitting MT depolymerization. B. Bead position at times shown (sec); last time shows trajectory of bead center for the entire motion. C. Distances from bead to pellicle as a function of time for 7 separate experiments. Movement began shortly after the MT cap was removed. D. Two consecutive times during the life of a PF from a depolymerizing MT that is stably attached to a “load”. The propagation of depolymerization, reflected in a progression of PF position, allows recycling KFs to transmit force to the load without a noticeable change in PF curvature where the KFs attach.

Comment in

References

    1. Arnal I, Heichette C, Diamantopoulos GS, Chretien D. CLIP-170/tubulin-curved oligomers coassemble at microtubule ends and promote rescues. Curr Biol. 2004;14:2086–2095. - PubMed
    1. Asbury CL, Gestaut DR, Powers AF, Franck AD, Davis TN. The Dam1 kinetochore complex harnesses microtubule dynamics to produce force and movement. Proc Natl Acad Sci U S A. 2006;103:9873–9878. - PMC - PubMed
    1. Cheeseman IM, Chappie JS, Wilson-Kubalek EM, Desai A. The conserved KMN network constitutes the core microtubule-binding site of the kinetochore. Cell. 2006;127:983–997. - PubMed
    1. Cheeseman IM, Desai A. Molecular architecture of the kinetochore-microtubule interface. Nat Rev Mol Cell Biol. 2008;9:33–46. - PubMed
    1. Cheeseman IM, Drubin DG, Barnes G. Simple centromere, complex kinetochore: linking spindle microtubules and centromeric DNA in budding yeast. J Cell Biol. 2002;157:199–203. - PMC - PubMed

Publication types