. 2008 Oct 17;135(2):343-54.
doi: 10.1016/j.cell.2008.08.034.

Cytokine-induced signaling networks prioritize dynamic range over signal strength

Affiliations

Cytokine-induced signaling networks prioritize dynamic range over signal strength

Kevin A Janes et al. Cell. .

Abstract

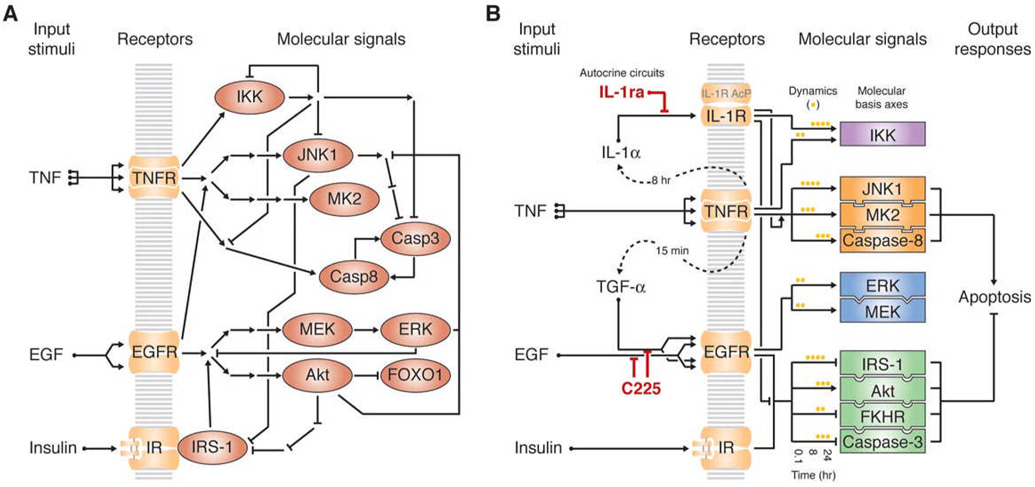
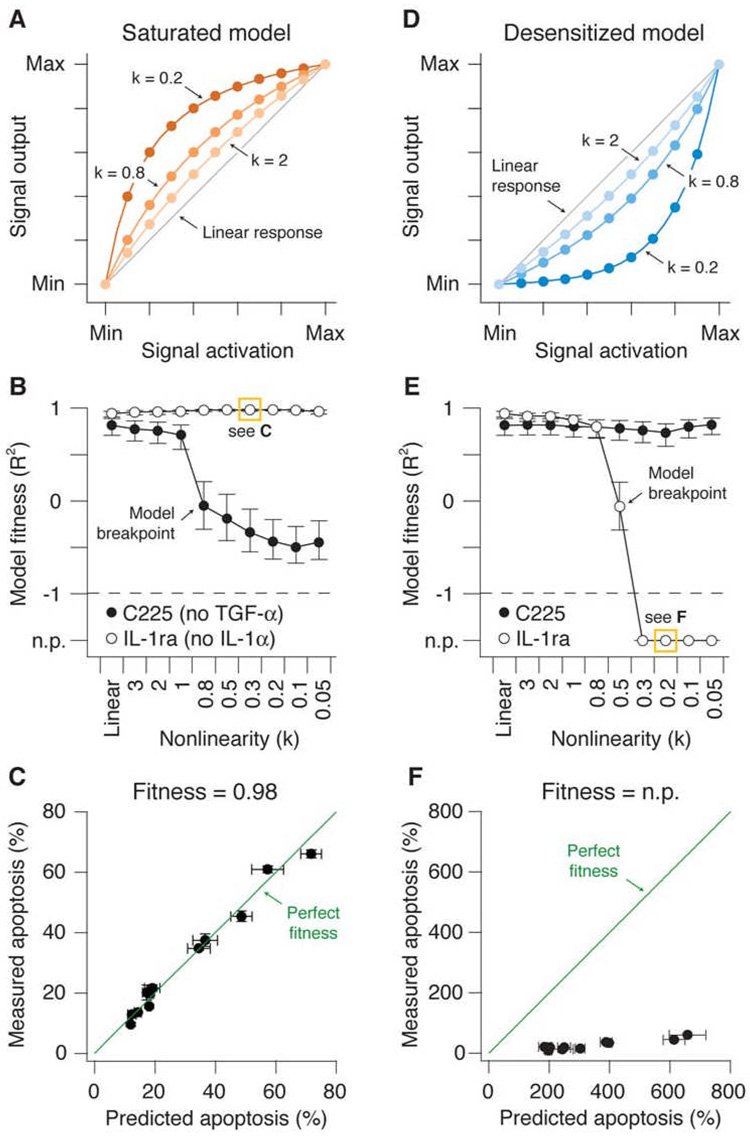
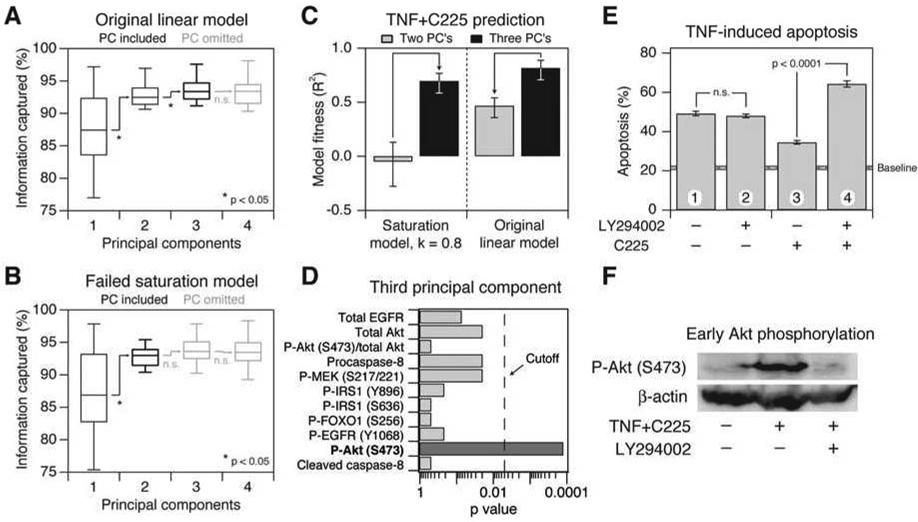
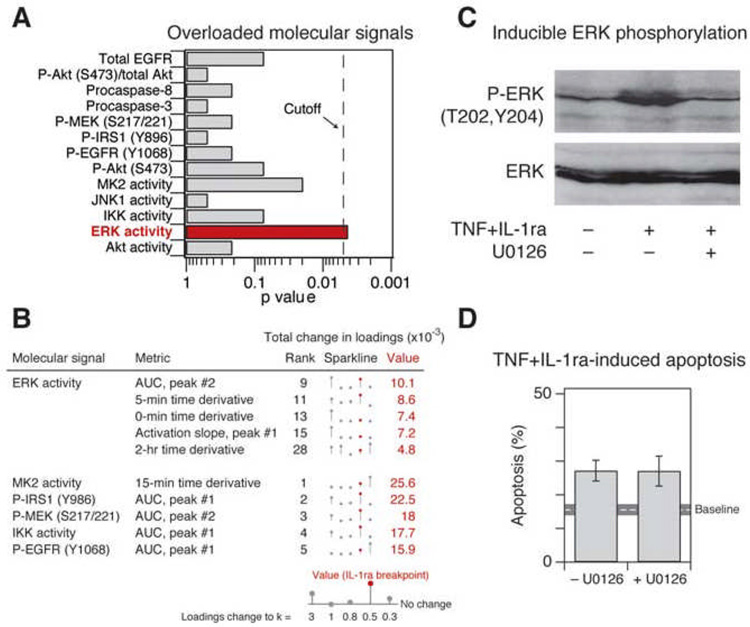
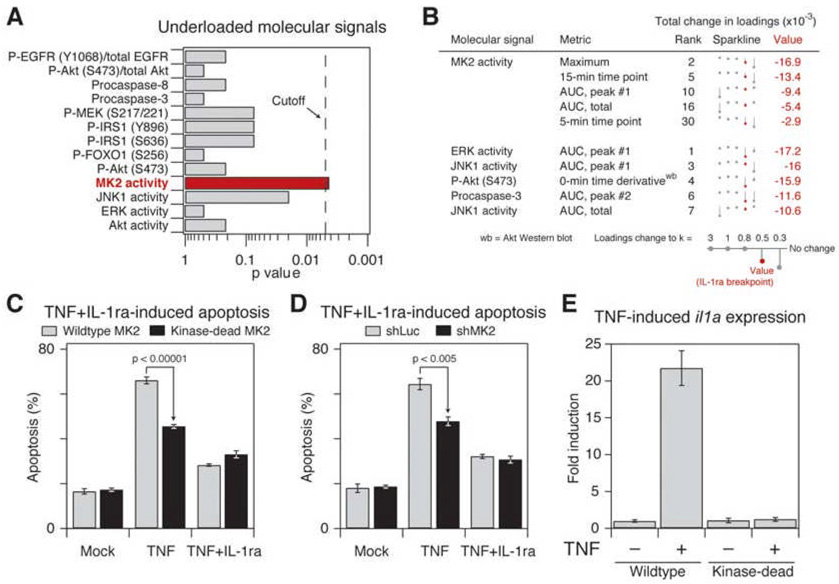
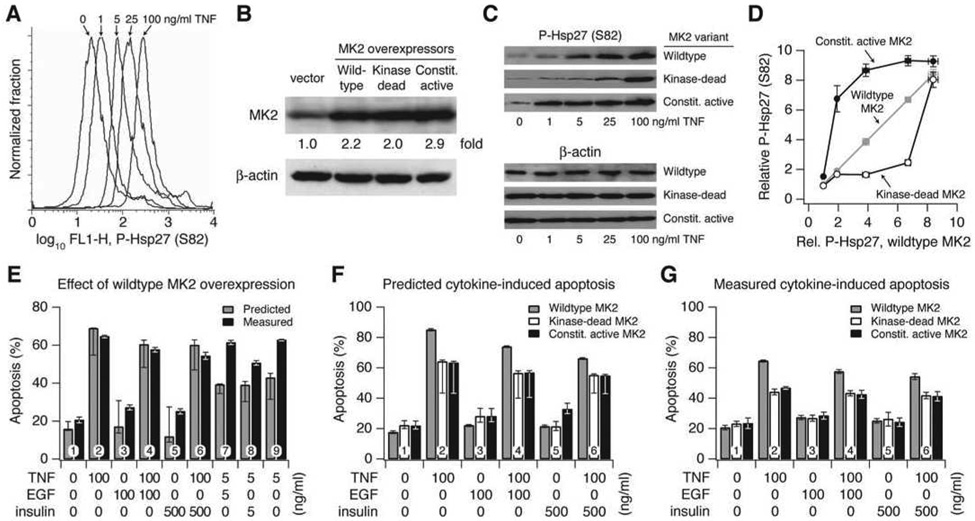
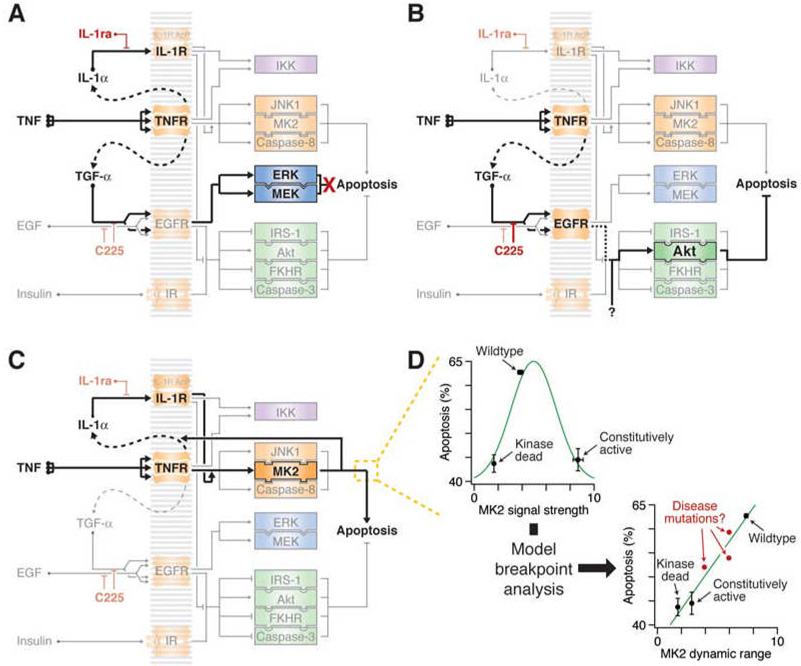
Signaling networks respond to diverse stimuli, but how the state of the signaling network is relayed to downstream cellular responses is unclear. We modeled how incremental activation of signaling molecules is transmitted to control apoptosis as a function of signal strength and dynamic range. A linear relationship between signal input and response output, with the dynamic range of signaling molecules uniformly distributed across activation states, most accurately predicted cellular responses. When nonlinearized signals with compressed dynamic range relay network activation to apoptosis, we observe catastrophic, stimulus-specific prediction failures. We develop a general computational technique, "model-breakpoint analysis," to analyze the mechanism of these failures, identifying new time- and stimulus-specific roles for Akt, ERK, and MK2 kinase activity in apoptosis, which were experimentally verified. Dynamic range is rarely measured in signal-transduction studies, but our experiments using model-breakpoint analysis suggest it may be a greater determinant of cell fate than measured signal strength.


Figures

Figure 1
Figure 1. The TNF–EGF–insulin apoptotic-signaling network
(A) Classic overview of the TNF–EGF–insulin network. Mechanistically connected activating signals are represented by arrows and inhibitory signals are shown by barred lines. Nodes corresponding to proteins whose activities we directly measured are shown as red ovals. (B) Systems overview of the TNF–EGF–insulin apoptotic-signaling network. Dashed lines indicate the autocrine cascade activated by TNF (Janes et al., 2006). The two perturbations of the TGF-α and IL-1α autocrine feedback circuits (by C225 and IL-1ra, respectively) are highlighted in red. Intracellular signals (rectangles) are divided into groups (purple, orange, blue, green) based on linked statistical dependencies identified by a data-driven model. A stress-apoptosis group (orange) and a cell-survival group (green) contribute heavily to two molecular basis axes, defined by the first two principal components of the model, which together accurately predict apoptosis induced by TNF, EGF, and insulin (Janes et al., 2005). A subset of time-dependent signals from these groups, indicated by yellow dots, form the largest contributors to the molecular basis axes of the network.
Figure 2
Figure 2. Selective failure of nonlinear models linking signal activation to signal output for predicting apoptosis
(A) The saturation model with k = 2, 0.8, and 0.2 compared to the original linear model (Linear response, gray line). Signal output was amplified at low levels of signal activation and saturated at moderate to high levels of signal activation. For all k values, the minimum (Min) and maximum (Max) observed values for each signaling metric were preserved. (B) Predictions of apoptosis after perturbation of the TGF-α autocrine feedback circuit with C225, or the IL-1α feedback loop with IL-1ra, in models with increasing saturation compared to the original linear model. The accuracy of predictions was quantified by model “fitness”, where a value of one is a perfect match between predicted and measured values. A specific data point boxed in yellow is further expanded in (C) as an example. The model breakpoint is indicated where catastrophic failure of the C225 prediction occurs. (C) An example of good model fitness. Measured and predicted apoptosis are shown for the 12 apoptotic readouts corresponding to the TNF+IL-1ra condition and a saturated model with k = 0.3, highlighted in (B). Perfect model fitness (= 1) is shown in green as a reference. (D) The desensitization model with k = 2, 0.8, and 0.2 compared to the original linear model (Linear response, gray line). Signal output was attenuated relative to true measured signal activation, particularly at low-to-moderate levels of activation. For all k values, the minimum (Min) and maximum (Max) observed values for each signaling metric were preserved. (E) Predictions of apoptosis after perturbation of the TGF-α autocrine feedback loop with C225, or the IL-1α feedback loop with IL-1ra, in models with increasing desensitization compared to the original linear model. Model fitnesses quantifying the agreement between prediction and experiment were calculated as in (A). A specific data point boxed in yellow is further expanded in (F) as an example. The model breakpoint is indicated where catastrophic failure of the IL-1ra prediction occurs. (F) An example of no prediction (n.p.). Measured and predicted apoptosis are shown for the 12 apoptotic readouts corresponding to the TNF+IL-1ra condition and a desensitized model with k = 0.2, highlighted in (E). Perfect model fitness (= 1) is shown in green as a reference. For (B) and (E) model fitness is shown as the R2 value ± 90% Fisher Z-transformed confidence intervals for the regression model: Measured apoptosis = Predicted apoptosis (see Experimental Procedures). For (C) and (F) data are shown as the central prediction ± crossvalidated standard error (s.e.) along the x-axis and the mean ± standard error of the mean (s.e.m.) of triplicate biological measurements along the y-axis. Apoptosis data are from four readouts measured by flow cytometry at three time points (Janes et al., 2005).
Figure 3
Figure 3. Failure of the saturation models involves loss of a principal component containing information from early Akt signaling
(A and B) Box-and-whisker plots showing the increase in information captured for (A) the original linear model and (B) the saturation model as the number of principal components is increased from one principal component to four. The midline indicates the median crossvalidated variance captured across the 12 apoptotic outputs measured, the boxes indicate the 25th and 75th percentiles, and the error bars indicate the 10th and 90th percentiles. Significant increases in variance captured were assessed by a one-sided sign-rank test. Principal components that were included in the predictive model are shown in black, and principal components that were omitted are shown in gray. (C) Changes in model fitness for the C225 prediction as the number of components for the saturation and linear models is changed from two principal components (gray) to three principal components (black). Model fitness is shown as R2 value ± 90% Fisher Z-transformed confidence intervals for the regression model: Measured apoptosis = Predicted apoptosis (see Experimental Procedures). (D) Akt signaling makes an important contribution to the third principal component when a two-component saturation model fails to predict apoptosis after TGF-α blockade. The statistical significance of any particular signal being over-represented in the top-30 metrics after inclusion of the third princpal component was examined by the binomial test (after correcting for multiple-hypothesis testing, a significance level [“Cutoff”] below 0.005 was required). Molecular signals are considered over-represented when significantly more metrics are observed in a list than would be expected by chance. See Table S1 for a complete list of molecular signals that contribute to the third principal component. (E) Early inhibition of Akt phosphorylation affects TNF-induced apoptosis only in the context of TGF-α blockade by C225. HT-29 cells were pretreated for 1 hr with 10 µg/ml C225 in the presence or absence of 20 µM LY294002 where indicated and then stimulated with 5 ng/ml TNF for 24 hr. At 3 hr after TNF stimulation, LY294002 was washed out by replacing the medium with conditioned medium from TNF+C225-treated cells. Apoptosis was measured by cleaved caspase-3 staining and flow cytometry (Janes et al., 2005). Data are shown as the mean ± s.e.m. of triplicate biological measurements. The baseline apoptosis induced by mock stimulation ± s.e.m. (gray line) is indicated. (F) Early TNF+C225-induced Akt phosphorylation is inhibited by LY294002. HT-29 cells were pretreated for 1 hr with 10 µg/ml C225 in the presence or absence of 20 µM LY294002 where indicated. Cells were then stimulated with 5 ng/ml TNF and Akt phosphorylation (P-Akt) was measured 15 min later by Western blotting with β-actin as a loading control.
Figure 4
Figure 4. Overloaded signaling metrics highlight irrelevant signaling information from ERK activity
(A) ERK activity is significantly over-represented among overloaded molecular signals in the desensitization model at the point of IL-1ra-prediction failure. Statistical significance of over-representation in the top-30 metrics was assessed as described in Figure 3D. (B) Overloading of ERK activity metrics contributes to failure of the desensitization model to predict apoptosis after IL-1α blockade at the breakpoint (indicated in Figure 2E). All ERK activity metrics in the top 30 metrics with the largest positive change are shown, along with the top five metrics that are not derived from ERK activity. Overall rank is shown to the right of the metric description. Changes in total loadings are depicted by sparklines (Tufte, 2006) bounded by the range of the data. The value at which the apoptosis prediction by IL-1ra first fails is highlighted in red. (C) TNF+IL-1ra induces ERK phosphorylation, which is inhibited by U0126. HT-29 cells were pretreated for 1 hr with 25 µM U0126 where indicated and then stimulated with 100 ng/ml TNF + 30 µg/ml IL-1ra for 15 min. ERK phosphorylation (P-ERK) was measured by Western blotting with total ERK levels used as a loading control. (D) Inhibition of ERK activity by U0126 pretreatment does not affect TNF+IL-1ra-induced apoptosis. HT-29 cells were pretreated for 1 hr with 25 µM U0126 where indicated and then stimulated with 100 ng/ml TNF + 30 µg/ml IL-1ra for 24 hr. Apoptosis was measured by cleaved caspase-3 staining and flow cytometry (Janes et al., 2005). Data are shown as the mean ± s.e.m. of triplicate biological measurements. The baseline apoptosis induced by mock stimulation ± s.e.m. (gray line) is indicated.
Figure 5
Figure 5. Failure of the desensitization model in the context of IL-1α blockade occurs by neglecting critical information from MK2
(A) MK2 activity is significantly underloaded in the desensitization model at the point of IL-1ra-prediction failure. Statistical significance of molecular signals that become underloaded in the desensitization model immediately following the breakpoint was assessed as described in Figure 3D. (B) All MK2 activity metrics in the top-30 metrics with the largest negative change at the point of model failure are shown, along with the top five metrics that are not derived from MK2 activity. Overall rank is shown to the right of the metric description. Changes in total loadings are depicted by sparklines (Tufte, 2006) bounded by the range of the data. The value at which the apoptosis prediction by IL-1ra first fails is highlighted in red. (C and D) MK2 signaling is important for IL-1α-dependent responses to TNF. (C) Changes in TNF- and TNF+IL-1ra-induced apoptosis in HT-29 cells overexpressing wildtype or kinase-dead MK2. (D) Changes in TNF- and TNF+IL-1ra-induced apoptosis in HT-29 cells stably expressing an shRNA for MK2 (shMK2) or control hairpin (shLuc). HT-29 cells were stimulated with 100 ng/ml TNF + 30 µg/ml IL-1ra for 24 hr, and apoptosis was measured by cleaved caspase-3 staining and flow cytometry (Janes et al., 2005). Data are shown as the mean ± s.e.m. of sextuplicate or quadruplicate biological measurements. Note that loss of MK2 signaling decreases apoptosis only when the IL-1α feedback loop is present. (E) MK2 signaling promotes sustained expression of il1a. HT-29 cells were stimulated with 100 ng/ml TNF for 1 hr and il1a mRNA levels measured by RT-qPCR. Data are shown as the mean ± s.e.m. of triplicate biological measurements.
Figure 6
Figure 6. Prediction and experiment indicate that wildtype MK2 signaling provides an optimum dynamic range for TNF-induced apoptosis
(A) Flow-cytometry profiles of HT-29 cells stimulated with the indicated TNF concentrations for 30 min and stained for P-Hsp27 levels showing a dose-dependent shift of the entire cell population, indicative of a uniform increase in MK2 activity. (B) Overexpression of wildtype, kinase-dead, and constitutively active MK2 in HT-29 cells, which represent multiplicative, desensitized, and saturated model variants. Cells were transduced with retroviral vectors containing the indicated MK2 constructs, and MK2 overexpression was quantified by Western blotting and densitometry compared to vector control cells. β-actin was used as a loading control. (C) HT-29 cells stably overexpressing wildtype, kinase-dead, and constitutively active MK2 were stimulated with the indicated TNF concentrations for 30 min, and P-Hsp27 was measured by Western blotting. β-actin was used as a loading control. (D) Densitometry quantifying relative P-Hsp27 levels in the MK2 retrovirally transduced cells after TNF stimulation as a function of P-Hsp27 measured for the same TNF concentration in wildtype MK2 overexpressing cells. (E) Comparison of measured and predicted apoptosis for HT-29 cells overexpressing wildtype MK2. Predictions closely matched experiments at high cytokine concentrations. (F) Predicted apoptosis for HT-29 cells overexpressing wildtype, kinase-dead, and constitutively active MK2 at high cytokine concentrations. Wildtype predictions are re-plotted from (E) for comparison. (G) Measured apoptosis for HT-29 cells overexpressing wildtype, kinase-dead, and constitutively active MK2 at high cytokine concentrations. Wildtype measurements are re-plotted from (E) for comparison. For (E) and (F), predictions are shown as the central prediction ± range of eight ([E]) or five ([F]) crossvalidation runs. For (E) and (G), HT-29 cells were stimulated with the indicated cytokine combinations for 24 hr, and apoptosis was measured by cleaved casapase-3 staining and flow cytometry (Janes et al., 2005). Data are shown as the mean ± s.e.m. of triplicate biological measurements. Note that expression of either the kinase-dead or the constitutively active MK2 causes decreased apoptosis compared to expression of wildtype MK2.
Figure 7
Figure 7. Context-specific and network-level mechanisms revealed by model-breakpoint analysis
(A) MEK–ERK signaling is not involved in TNF-induced apoptosis. (B) Early Akt activity sends a pro-survival signal when TNF-induced TGF-α autocrine signaling is blocked. An unknown activator of early Akt (“?”) must be critical for the pro-survival function. (C) Wildtype MK2 signaling promotes TNF-induced apoptosis by stabilizing the autocrine IL-1α circuit. (D) The dynamic range of MK2 is more predictive of its apoptotic contribution than MK2 signal strength. (Upper left) Apoptosis induced by 5 ng/ml TNF is plotted against MK2 signal strength as measured by P-Hsp27 in Figure 6C. Apoptosis increases then decreases with signal strength (green curve). (Lower right) Apoptosis induced by 5 ng/ml TNF is plotted against MK2 dynamic range as defined by the range of signal strengths where the slope of activation compared to wildtype MK2 is greater than or equal to one in Figure 6D. Apoptosis appears to increase proportionally with dynamic range (green curve). Disease mutations (red) may cause perturbations in dynamic range that fall between the wildype and the hyperactive-hypoactive alleles.

References

    1. Albeck JG, MacBeath G, White FM, Sorger PK, Lauffenburger DA, Gaudet S. Collecting and organizing systematic sets of protein data. Nat Rev Mol Cell Biol. 2006;7:803–812. - PubMed
    1. Ballif BA, Blenis J. Molecular mechanisms mediating mammalian mitogen-activated protein kinase (MAPK) kinase (MEK)-MAPK cell survival signals. Cell Growth Differ. 2001;12:397–408. - PubMed
    1. Blume-Jensen P, Hunter T. Oncogenic kinase signalling. Nature. 2001;411:355–365. - PubMed
    1. Campbell KJ, Rocha S, Perkins ND. Active repression of antiapoptotic gene expression by RelA(p65) NF-kappa B. Mol Cell. 2004;13:853–865. - PubMed
    1. Cary LA, Han DC, Polte TR, Hanks SK, Guan JL. Identification of p130Cas as a mediator of focal adhesion kinase-promoted cell migration. J Cell Biol. 1998;140:211–221. - PMC - PubMed

Publication types