. 2008 Nov 4;105(44):17157-62.
doi: 10.1073/pnas.0809353105. Epub 2008 Oct 28.

Dynamical relaying can yield zero time lag neuronal synchrony despite long conduction delays

Affiliations

Dynamical relaying can yield zero time lag neuronal synchrony despite long conduction delays

Raul Vicente et al. Proc Natl Acad Sci U S A. .

Abstract

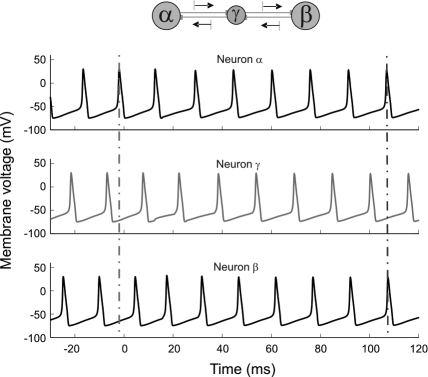
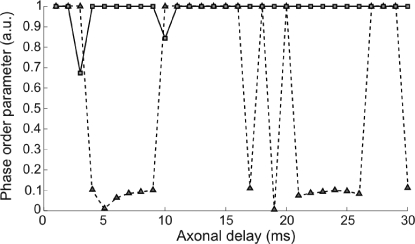
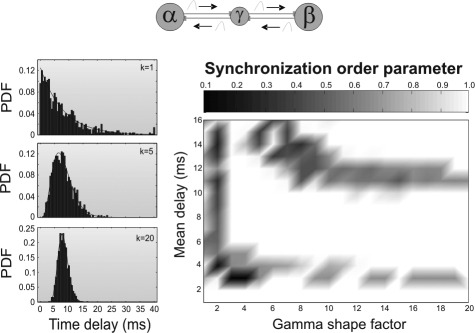
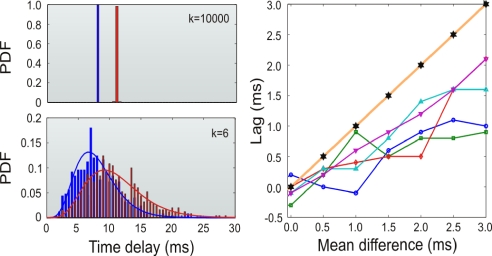
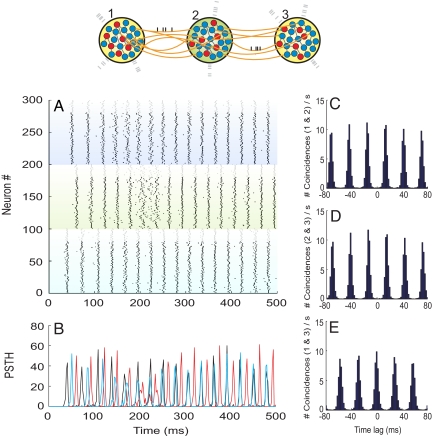
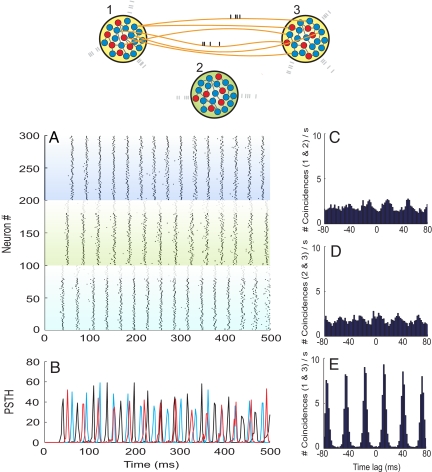
Multielectrode recordings have revealed zero time lag synchronization among remote cerebral cortical areas. However, the axonal conduction delays among such distant regions can amount to several tens of milliseconds. It is still unclear which mechanism is giving rise to isochronous discharge of widely distributed neurons, despite such latencies. Here, we investigate the synchronization properties of a simple network motif and found that, even in the presence of large axonal conduction delays, distant neuronal populations self-organize into lag-free oscillations. According to our results, cortico-cortical association fibers and certain cortico-thalamo-cortical loops represent ideal circuits to circumvent the phase shifts and time lags associated with conduction delays.


Conflict of interest statement

The authors declare no conflict of interest.

Figures

Fig. 1.
Fig. 1.
Time series of the membrane voltage of 3 coupled HH cells Nα-Nβ-Nγ. At time t = 0 the excitatory synapses were activated. Conduction delay τ = 8 ms. Vertical lines help the eye to compare the spike synchrony before and after the interaction takes place.
Fig. 2.
Fig. 2.
Dependence of zero time lag synchronization as a function of the axonal delay between neighbor cells for a scheme of 2 coupled neurons (dashed line) and 3 coupled neurons (solid line). In the case of the 3 interacting cells, only the synchrony between the outer neurons is plotted here.
Fig. 3.
Fig. 3.
Effects of broad distributions of axonal delays on synchrony. (Left) γ distribution of delays with different shape factors (k = 1, 5, and 20) and the same mean (τ = 8 ms). (Right) Synchronization index at zero lag of the outer neurons as a function of the shape factor and mean of the distribution of delays.
Fig. 4.
Fig. 4.
Effects of dissimilar distributions of axonal delays on the lag of synchronization. (Left) different γ distributions of delays used for the 2 dissimilar branches of the network module. (Upper) Distributions with shape factor k = 10,000 (quasi-δ) and means of 8 and 11 ms. (Lower) Distributions with shape factor k = 6 and means of 8 and 11 ms. (Right) Lag between the discharges of the outer neurons as a function of the difference in the mean of the distributions of delays for the 2 branches. Shape factors k = 6 (squares), k = 8 (circles), k = 10 (diamonds), k = 12 (upright triangles), k = 14 (inverted triangles), and k = 10,000 (stars) were tested.
Fig. 5.
Fig. 5.
Dynamics of 3 large-scale networks interacting through dynamical relaying. (A) Raster plot of 300 neurons randomly selected among the 3 populations (neurons 1–100 are from population 1, 101–200 from population 2, and 201–300 from population 3). The top 20 neurons of each subpopulation (plotted in gray) are inhibitory, and the rest are excitatory (black). (B) Firing histogram of each subpopulation of 100 randomly selected neurons (black, red, and blue colors code for populations 1, 2, and 3, respectively). (C) Averaged cross-correlogram between neurons of populations 1 and 2. (D) Averaged cross-correlogram between neurons of populations 2 and 3. (E) Averaged cross-correlogram between neurons of populations 1 and 3. At t = 100 ms, the external interpopulation synapses become active. Bin sizes for the histogram and correlograms are set to 2 ms. Interpopulation axonal delays are set to 12 ms.
Fig. 6.
Fig. 6.
Dynamics of 2 large-scale networks interacting directly. Population 2 is disconnected from other populations. Structure of the panels and parameters are otherwise as in Fig. 5.

References

    1. Gray CM, Konig P, Engel AK, Singer W. Oscillatory responses in cat visual cortex exhibit intercolumnar synchronization which reflects global stimulus properties. Nature. 1989;338:334–337. - PubMed
    1. Engel AK, Kreiter AK, Konig P, Singer W. Synchronization of oscillatory neuronal responses between striate and extrastriate visual cortical areas of the cat. Proc Natl Acad Sci USA. 1991;88:6048–6052. - PMC - PubMed
    1. Castelo-Branco M, Goebel R, Neuenschwander S, Singer W. Neuronal synchrony correlates with surface segregation rules. Nature. 2000;405:685–689. - PubMed
    1. Tiesinga P, Fellows JM, Sejnowski T. Regulation of spike timing in visual cortical circuits. Nat Rev Neurosci. 2008;9:97–109. - PMC - PubMed
    1. Traub RD, Whittington MA, Stanford IM, Jefferys JGR. A mechanism for generation of long-range synchronous fast oscillations in the cortex. Nature. 1996;383:621–624. - PubMed

Publication types