. 2009 Jan;181(1):33-7.
doi: 10.1534/genetics.108.096487. Epub 2008 Oct 28.

Rapid high resolution single nucleotide polymorphism-comparative genome hybridization mapping in Caenorhabditis elegans

Affiliations

Rapid high resolution single nucleotide polymorphism-comparative genome hybridization mapping in Caenorhabditis elegans

Stephane Flibotte et al. Genetics. 2009 Jan.

Abstract

We have developed a significantly improved and simplified method for high-resolution mapping of phenotypic traits in Caenorhabditis elegans using a combination of single nucleotide polymorphisms (SNPs) and oligo array comparative genome hybridization (array CGH). We designed a custom oligonucleotide array using a subset of confirmed SNPs between the canonical wild-type Bristol strain N2 and the Hawaiian isolate CB4856, populated with densely overlapping 50-mer probes corresponding to both N2 and CB4856 SNP sequences. Using this method a mutation can be mapped to a resolution of approximately 200 kb in a single genetic cross. Six mutations representing each of the C. elegans chromosomes were detected unambiguously and at high resolution using genomic DNA from populations derived from as few as 100 homozygous mutant segregants of mutant N2/CB4856 heterozygotes. Our method completely dispenses with the PCR, restriction digest, and gel analysis of standard SNP mapping and should be easy to extend to any organism with interbreeding strains. This method will be particularly powerful when applied to difficult or hard-to-map low-penetrance phenotypes. It should also be possible to map polygenic traits using this method.


Figures

F<sc>igure</sc> 1.—
Figure 1.—
Effect of the position of a single nucleotide substitution within oligonucleotide probes in a comparative genomic hybridization experiment. The figure shows the average comparative genomic hybridization profile for 2639 single nucleotide substitutions between the CB4856 and the N2 strain of C. elegans. More specifically, the average of log2 (fluorescence intensity CB4856/fluorescence intensityN2) is shown as a function of the chromosomal coordinate of the left end of each 50-mer probe relative to the coordinate of the substitution. Probes following the plus and minus strand templates of the N2 Bristol sequence are represented by red and blue circles, respectively. Probes with relative positions < −50 or >0 are in the immediate flanking region of a substitution but do not overlap known substitutions. Since the probes are always synthesized from the 3′ to the 5′ end on the microarray, the probes following the plus and minus strand sequences show nearly identical hybridization patterns with a maximum perturbation when the substitution is located near the seventh nucleotide from the end away from the glass slide and freely floating in solution.
F<sc>igure</sc> 2.—
Figure 2.—
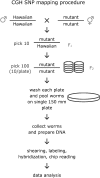
Schematic of genetic crosses and downstream processing required to perform SNP-CGH mapping. For this analysis we chose six marker mutations of known physical location, one for each chromosome. These were dpy-5(e61) I (F27C1.8), dpy-10(e128) II (T14B4.7), dpy-17(e164) III (F54D8.1), unc-22(e66) IV (ZK617.1), dpy-11(e224) V (F46E10.9), and unc-2(ra612) X (T02C5.5). Details of crosses, DNA preparations, microarray hybridization, and analysis are described in the materials and methods (also see Maydan et al. 2007).
F<sc>igure</sc> 3.—
Figure 3.—
Whole genome views of the mapping signal for six previously known mutations. For each single nucleotide substitution represented on the microarray the difference between the median log2 ratio for probes with N2 and CB4856 sequences is plotted by increasing chromosome number and location from left to right. The mapping signal for each chromosome is shown with data points of different color (red for I, yellow for II, green for III, cyan for IV, blue for V, and magenta for X). The known location of each mutation is (a) chromosome I coordinate 5,432,448 with closest SNP index of 140; (b) chromosome II coordinate 6,712,800 with closest SNP index of 606; (c) chromosome III coordinate 5,107,908 with closest SNP index of 1057; (d) chromosome IV coordinate 12,011,000 with closest SNP index of 1590; (e) chromosome V coordinate 6,512,776 with closest SNP index of 2043; and finally (f) chromosome X coordinate 2,717,348 with closest SNP index of 2629.
F<sc>igure</sc> 4.—
Figure 4.—
Views of the mapping signal for a mutation located on chromosome I. The mapping signal is plotted with open black circles for each substitution represented on the microarray as a function of chromosome I coordinate. The blue lines and blue squares represent a cubic smoothing spline fit to the mapping signal and the vertical red lines indicate the actual location of the mutation being mapped. The whole chromosome view shown in a and b focuses on a small interval around the mutation. The maximum of the fit can be taken as our best estimate of the location of the mutation with the current mapping array. Since our prediction is just one data point away from the real position of the mutation, we should be able to improve the mapping resolution by increasing the number of substitutions represented on the array.

References

    1. Carlson, C. S., M. A. Eberle, M. J. Rieder, Q. Yi, L. Kruglyak et al., 2004. Selecting a maximally informative set of single-nucleotide polymorphisms for association analyses using linkage disequilibrium. Am. J. Hum. Genet. 74 106–120. - PMC - PubMed
    1. Chen, D., A. Ahlford, F. Schnorrer, I. Kalchhauser, M. Fellner et al., 2008. High-resolution, high-throughput SNP mapping in Drosophila melanogaster. Nat. Methods 5 323–329. - PubMed
    1. Davis, M. W., M. Hammerlund, T. Harrach, P. Hullett, S. Olsen et al., 2005. Rapid single nucleotide polymorphism mapping in C. elegans. BMC Genomics 6 118. - PMC - PubMed
    1. Hillier, L. W., R. D. Miller, S. E. Baird, A. Chinwalla, L. A. Fulton et al., 2007. Comparison of C. elegans and C. briggsae genome sequences reveals extensive conservation of chromosome organization and synteny. PLoS Biol. 5 e167. - PMC - PubMed
    1. Hillier, L.W., G. T. Marth, A. R. Quinlin, D. Dooling, G. Fewell et al., 2008. Whole-genome sequencing and variant discovery in C. elegans. Nat. Methods 5 183–188. - PubMed

Publication types

Substances