

Tissue elasticity properties as biomarkers for prostate cancer
- PMID: 18957712
- PMCID: PMC3144495
- DOI: 10.3233/cbm-2008-44-505
Tissue elasticity properties as biomarkers for prostate cancer
Abstract
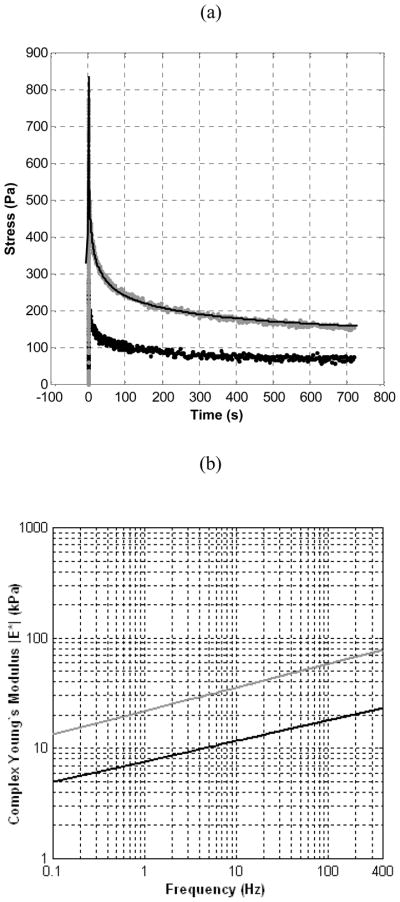
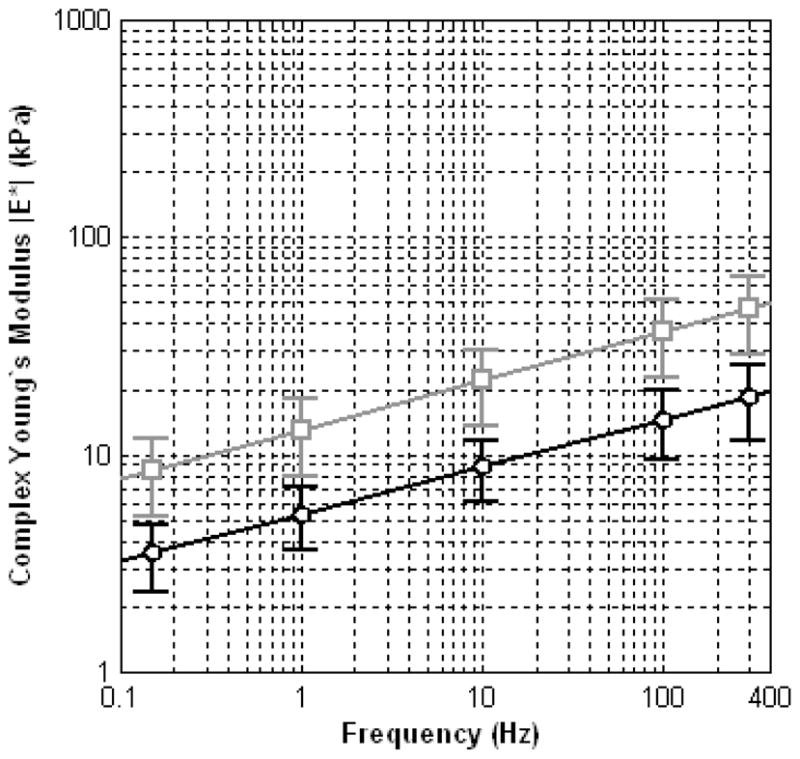
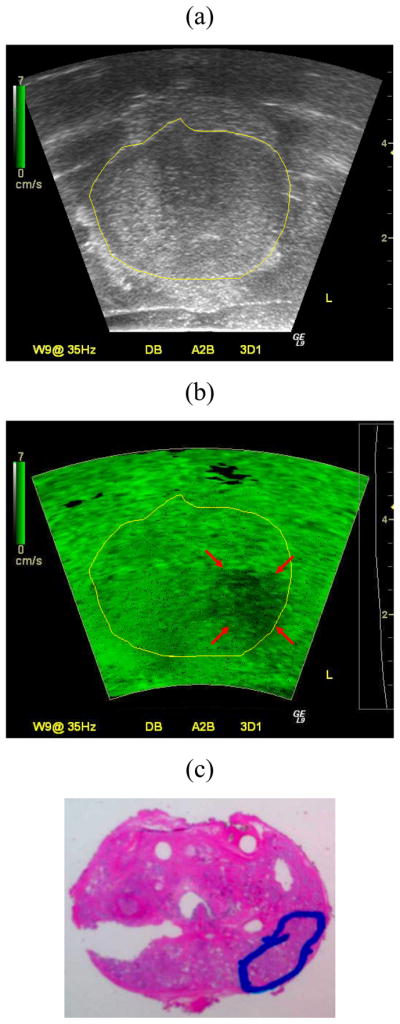
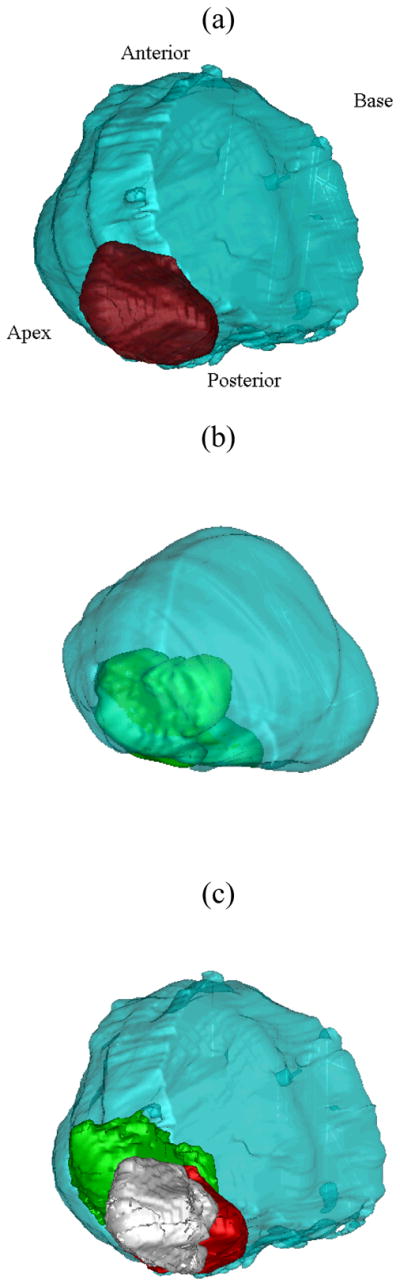
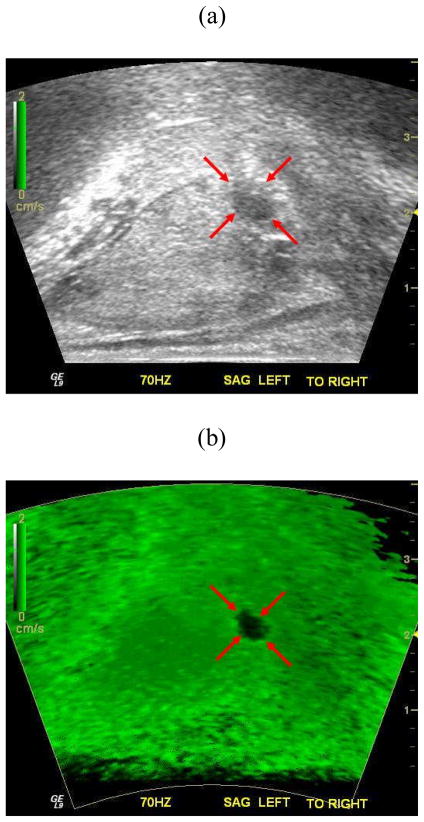
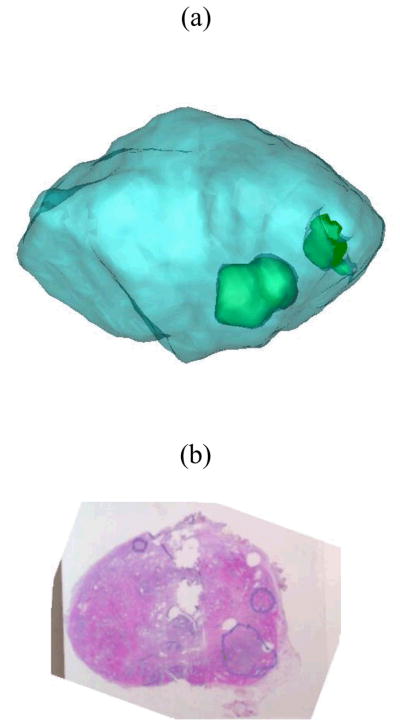
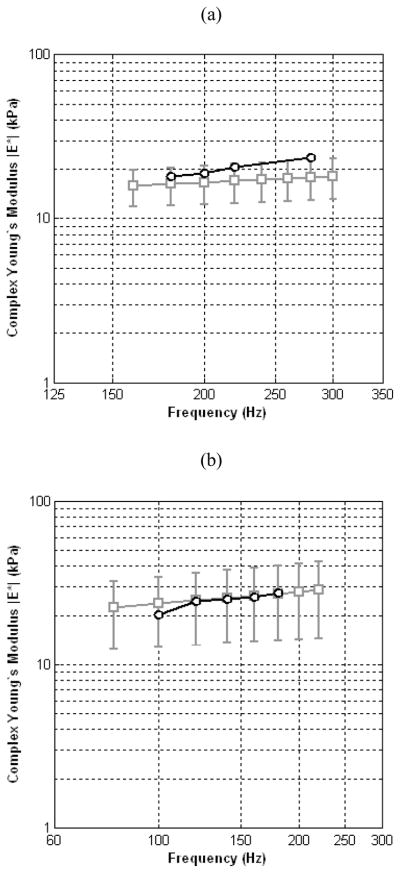
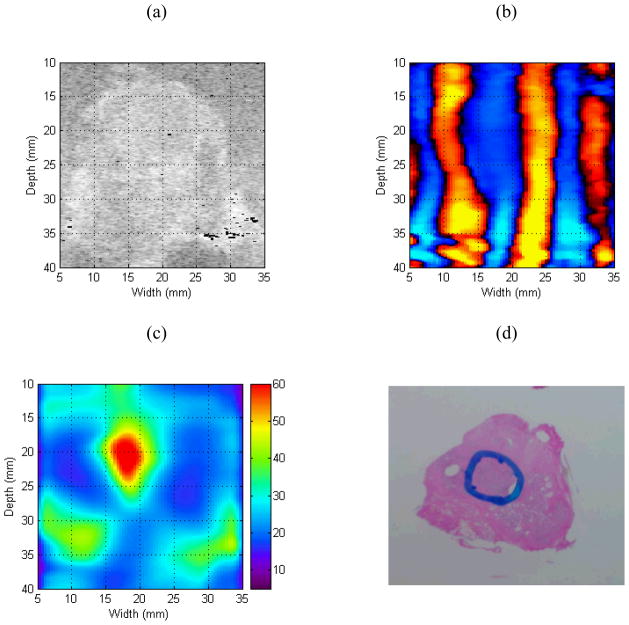
In this paper we evaluate tissue elasticity as a longstanding but qualitative biomarker for prostate cancer and sonoelastography as an emerging imaging tool for providing qualitative and quantitative measurements of prostate tissue stiffness. A Kelvin-Voigt Fractional Derivative (KVFD) viscoelastic model was used to characterize mechanical stress relaxation data measured from human prostate tissue samples. Mechanical testing results revealed that the viscosity parameter for cancerous prostate tissue is greater than that derived from normal tissue by a factor of approximately 2.4. It was also determined that a significant difference exists between normal and cancerous prostate tissue stiffness (p < 0.01) yielding an average elastic contrast that increases from 2.1 at 0.1 Hz to 2.5 at 150 Hz. Qualitative sonoelastographic results show promise for cancer detection in prostate and may prove to be an effective adjunct imaging technique for biopsy guidance. Elasticity images obtained with quantitative sonoelastography agree with mechanical testing and histological results. Overall, results indicate tissue elasticity is a promising biomarker for prostate cancer.
Figures
Similar articles
-
Quantitative characterization of viscoelastic properties of human prostate correlated with histology.Ultrasound Med Biol. 2008 Jul;34(7):1033-42. doi: 10.1016/j.ultrasmedbio.2007.11.024. Epub 2008 Feb 6. Ultrasound Med Biol. 2008. PMID: 18258350
-
Crawling wave detection of prostate cancer: preliminary in vitro results.Med Phys. 2011 May;38(5):2563-71. doi: 10.1118/1.3569578. Med Phys. 2011. PMID: 21776792 Free PMC article.
-
Characterizing stiffness of human prostates using acoustic radiation force.Ultrason Imaging. 2010 Oct;32(4):201-13. doi: 10.1177/016173461003200401. Ultrason Imaging. 2010. PMID: 21213566 Free PMC article.
-
[The value of real-time elastography in the diagnosis of prostate cancer].Urologe A. 2009 Jun;48(6):628-36. doi: 10.1007/s00120-009-1964-x. Urologe A. 2009. PMID: 19300978 Review. German.
-
Real-time elastography for the detection of prostate cancer.Curr Urol Rep. 2014 Mar;15(3):392. doi: 10.1007/s11934-013-0392-z. Curr Urol Rep. 2014. PMID: 24452740 Review.
Cited by
-
A feasibility study of novel ultrasonic tissue characterization for prostate-cancer diagnosis: 2D spectrum analysis of in vivo data with histology as gold standard.Med Phys. 2009 Aug;36(8):3504-11. doi: 10.1118/1.3166360. Med Phys. 2009. PMID: 19746784 Free PMC article.
-
Strain Elastography-Targeted Biopsy: Does Prostate Volume Affect Prostate Cancer Detection?Med Sci Monit. 2019 Nov 22;25:8836-8842. doi: 10.12659/MSM.917344. Med Sci Monit. 2019. PMID: 31754091 Free PMC article.
-
Elastography: modality-specific approaches, clinical applications, and research horizons.Skeletal Radiol. 2011 Apr;40(4):389-97. doi: 10.1007/s00256-010-0918-0. Epub 2010 Mar 30. Skeletal Radiol. 2011. PMID: 20352427 Review.
-
Focal low-dose rate brachytherapy for the treatment of prostate cancer.Cancer Manag Res. 2013 Sep 13;5:315-25. doi: 10.2147/CMAR.S33056. eCollection 2013. Cancer Manag Res. 2013. PMID: 24049459 Free PMC article. Review.
-
Free-radicals and advanced chemistries involved in cell membrane organization influence oxygen diffusion and pathology treatment.AIMS Biophys. 2017;4(2):240-283. doi: 10.3934/biophy.2017.2.240. Epub 2017 Apr 6. AIMS Biophys. 2017. PMID: 29202036 Free PMC article.
References
-
- American Cancer Society. Cancer Facts and Figures 2007. American Cancer Society; 2007.
-
- Portnoy RK, Lesage P. Management of cancer pain. Lancet. 1999;353:1695–1700. - PubMed
-
- Roodman GD. Mechanisms of bone metastasis. N Engl J Med. 2004;350:1655–1664. - PubMed
-
- Anderson WAD, Kissane JM. Pathology. Vol. 2. C.V. Mosby Company; Saint Louis, Missouri: 1977.
-
- Dvorak HF. Wounds that do not heal. N Engl J Med. 1986;315:1650–1659. - PubMed
Publication types
MeSH terms
Substances
Grants and funding
LinkOut - more resources
Full Text Sources
Other Literature Sources
Medical
