. 2008 Mar 28:1:13.
doi: 10.3389/neuro.09.013.2007. eCollection 2007.

An information theoretical approach to task-switching: evidence from cognitive brain potentials in humans

An information theoretical approach to task-switching: evidence from cognitive brain potentials in humans

Francisco Barceló et al. Front Hum Neurosci. .

Abstract

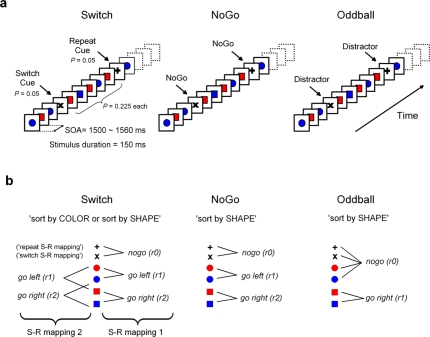
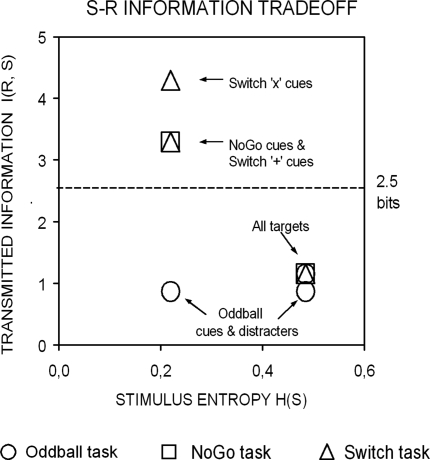
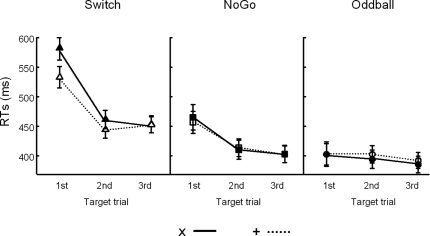
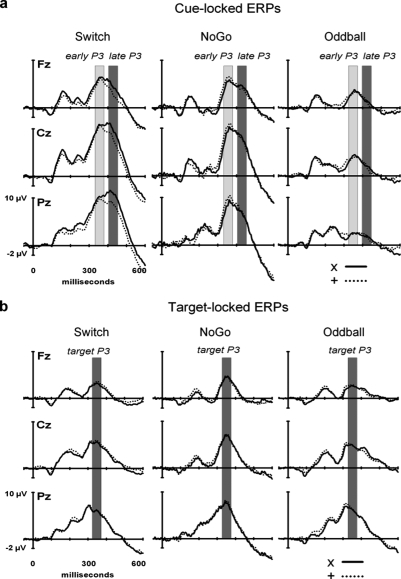
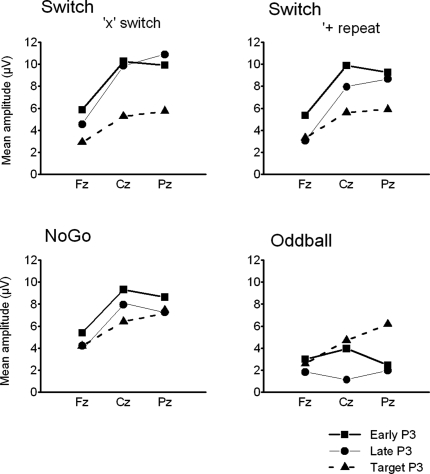
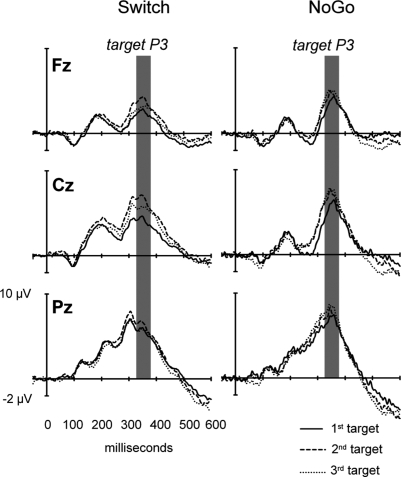
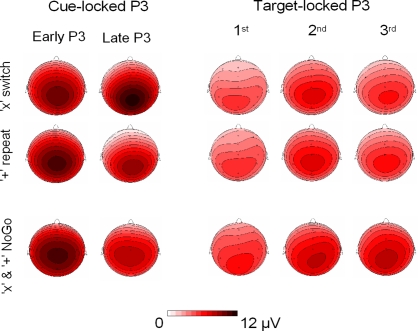
This study aimed to clarify the neural substrates of behavioral switch and restart costs in intermittently instructed task-switching paradigms. Event-related potentials (ERPs) were recorded while participants were intermittently cued to switch or repeat their categorization rule (Switch task), or else they performed two perceptually identical control conditions (NoGo and Oddball). The three tasks involved different task-sets with distinct stimulus-response associations in each, but identical visual stimulation, consisting of frequent colored shapes (p = 0.9) and randomly interspersed infrequent black shapes (p = 0.1; '+' and 'x' symbols). Behavioral restart costs were observed in the first target responses following all black shapes in the Switch and NoGo tasks - but not in the Oddball task - and corresponded with enhanced fronto-centrally distributed early cue-locked P3 activity (peak latency 325-375 ms post-cue onset at the vertex). In turn, behavioral switch costs were associated with larger late cue-locked P3 amplitudes in the Switch task only (peak latency 400-450 ms post-cue onset at mid-parietal sites). Together with our information theoretical estimations, ERP results suggested that restart and switch costs indexed two neural mechanisms related to the preparatory resolution of uncertainty: (1) the intermittent re-activation of task-set information, and (2) the updating of stimulus-response mappings within an active task set, as indexed by early and late cue-locked P3 activations, respectively. In contrast, target-locked P3 activations reflected a functionally distinct mechanism related to the implementation of task-set information. We conclude that task-switching costs consist of both switch-specific and switch-unspecific processes during the preparation and execution stages of task performance.

Keywords: cognitive control; information theory; novelty; response uncertainty; set shifting; working memory.


Figures

Figure 1
Figure 1
Experimental design and task-set information. (A) Stimulus material. All 3 tasks consisted of the same sequence of frequent colored shapes (p = 0.9) with semi-randomly interspersed infrequent black symbols (p = 0.05 for both ‘+’ and ‘x’ symbols). In the Switch task, symbols ‘x’ and ‘+’ instructed subjects to switch and repeat the previous S-R mapping, respectively. The NoGo task consisted of two-forced response choices (i.e., ‘press button 1 for circles and button 2 for squares’), whereas the Oddball task involved one-forced response trials (i.e., ‘press button 1 for squares’). Subjects were explicitly instructed not to respond to the black symbols ‘x’ and ‘+’ in the NoGo and Oddball tasks. (B) Hypothetical task-set information and S–R mappings. Task demands were manipulated (1) by varying the amount of task-set information to be handled in working memory (Oddball vs. NoGo tasks); and (2) by varying the contextual meaning of black symbols for updating the active S–R mappings (NoGo vs. Switch tasks; see Tables 1 and 2).
Figure 2
Figure 2
A priori estimations of transmitted information between stimuli and responses as a function of the sensory entropy of black symbols (0.22 bits) and colored-shaped stimuli (0.48 bits) in the 3 task conditions (after Miller, 1956). Visual targets conveyed the same information for response selection in all 3 task conditions. In turn, black symbols conveyed varying amounts of information for response selection in the Oddball, NoGo and Switch tasks. In the Switch task, ‘x’ switch cues conveyed 1 more bit of information than ‘+’ repeat cues for updating the active S–R mapping (see Tables 1 and 2 and the “Appendix” section; cf. Koechlin et al., 2003).
Figure 3
Figure 3
Behavioral results. Mean reaction times (RTs) and SEM to visual targets as a function of their sequential position following black symbols in the 3 task conditions.
Figure 4
Figure 4
Event-related potentials (ERPs) at 3 midline electrodes (Fz, Cz, Pz). (A) Grand cue-locked ERPs elicited by black symbols ‘x’ and ‘+’ in the Switch, NoGo, and Oddball conditions. (B) Grand target-locked ERPs to black symbols ‘x’ and ‘+’ in the Switch, NoGo, and Oddball task conditions (with 1st, 2nd and 3rd targets trials collapsed). Gray bars show the latency windows for amplitude measurements of the early and late aspects of cue-locked P3 activity, and for target-locked P3 activity.
Figure 5
Figure 5
Summary of grand mean amplitudes from 3 midline electrodes (Fz, Cz, Pz) of early and late cue-locked P3 and target-locked P3 activations in the 3 task conditions: Switch (comparing ‘x’ switch and ‘+’ repeat trials), NoGo and Oddball tasks (with ‘x’ and ‘+’ trials collapsed). Note the distinct scalp distribution of cue-locked P3 – but not of target-locked P3 – activity across the 3 task conditions.
Figure 6
Figure 6
Target-locked ERPs to 3 consecutive targets trials in the Switch and NoGo tasks. Grand ERP waveforms elicited by the 1st, 2nd and 3rd targets in a sequence of trials (with ‘x’ and ‘+’ trials collapsed). The data are shown from 3 midline electrodes (Fz, Cz, Pz). Gray bars indicate the latency window for measurement of mean target-locked P3 amplitudes.
Figure 7
Figure 7
Scalp topography of cue-locked P3 and target-locked P3 amplitudes in the Switch (upper 2 rows) and NoGo tasks (lower row, with ‘x’ and ‘+’ trials collapsed). The topographic maps for cue-locked P3 activity were computed from the mean voltages of early P3 (325–375 ms) and late P3 (400–450 ms), respectively. Topographic maps for target P3 activity (325–375 ms) are displayed for the 1st, 2nd, and 3rd target trials following a black symbol.

References

    1. Allport A. (1987). Selection for action: some behavioral and neurophysiological considerations of attention and action. In Perspectives on Perception and Action, Heuer H., Sanders A. F., eds (Hillsdale, NJ, Lawrence Erlbaum Associates; ), pp. 395–419
    1. Allport A., Wylie G. (2000). Task-switching, stimulus-response bindings and negative priming. In Control of Cognitive Processes: Attention and Performance XVIII, Monsell S., Driver J., eds (Cambridge, MA, MIT Press; ), pp. 35–70
    1. Altmann E. M. (2002). Functional decay of memory for tasks. Psychol. Res. 66, 287–297 10.1007/s00426-002-0102-9 - DOI - PubMed
    1. Barcelo F. (2003). The Madrid card sorting test (MCST): a task switching paradigm to study executive attention with event-related potentials. Brain Res. Brain Res. Protoc. 11, 27–37 10.1016/S1385-299X(03)00013-8 - DOI - PubMed
    1. Barcelo F., Escera C., Corral M. J., Perianez J. A. (2006). Task switching and novelty processing activate a common neural network for cognitive control. J. Cogn. Neurosci. 18, 1734–1748 10.1162/jocn.2006.18.10.1734 - DOI - PubMed

LinkOut - more resources