. 2008 Apr 8:1:3.
doi: 10.3389/neuro.06.003.2007. eCollection 2007.

Odor concentration invariance by chemical ratio coding

Affiliations

Odor concentration invariance by chemical ratio coding

Naoshige Uchida et al. Front Syst Neurosci. .

Abstract

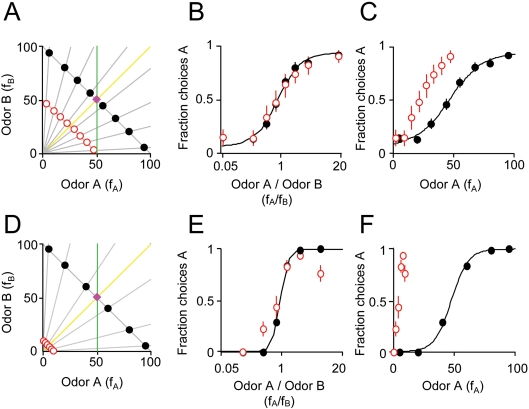
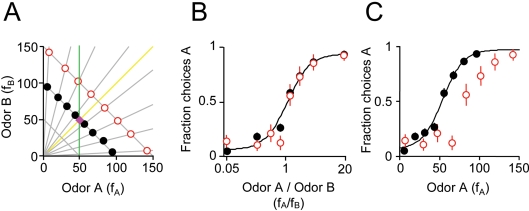
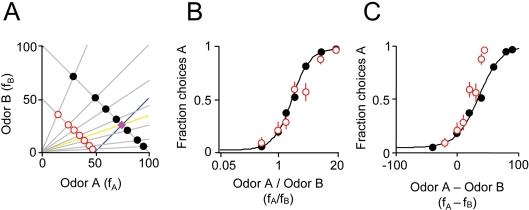
Many animal species rely on chemical signals to extract ecologically important information from the environment. Yet in natural conditions chemical signals will frequently undergo concentration changes that produce differences in both level and pattern of activation of olfactory receptor neurons. Thus, a central problem in olfactory processing is how the system is able to recognize the same stimulus across different concentrations. To signal species identity for mate recognition, some insects use the ratio of two components in a binary chemical mixture to produce a code that is invariant to dilution. Here, using psychophysical methods, we show that rats also classify binary odor mixtures according to the molar ratios of their components, spontaneously generalizing over at least a tenfold concentration range. These results indicate that extracting chemical ratio information is not restricted to pheromone signaling and suggest a general solution for concentration-invariant odor recognition by the mammalian olfactory system.

Keywords: concentration-invariance; odor recognition; olfaction; ratio.


Figures

Figure 1
Figure 1
Odor mixture discrimination by rats respects the ratio of mixture components. (A) Stimuli were binary mixtures of two odorants (A, caproic acid; B, 1-hexanol) whose magnitudes, fA and fB, were varied by air flow dilution (100 = 60 ml/min of saturated vapor diluted in 1,000 ml/min clean air, see Materials and methods section). Training stimuli (black filled circles) were rewarded according to the dominant component. The reward boundary is indicated by the magenta diamond. Note that training stimuli were chosen such that fA + fB = 100. Test stimuli (red circles) were randomly rewarded (p = 0.5). Note that test stimuli were chosen to have fA + fB = 50. Note that training and test stimuli were chosen with the same component ratios (as indicated by the gray lines). The yellow line (fA/fB = 1) represents stimulus classification based on ratio of two mixture components. The green line (fA = 50) represents a classification boundary based on one component (A). Note that yellow and green lines both correctly classify the training stimuli but result in different classifications of the test stimuli. (B) Performance of one rat on training odors (black filled circles) and probes (red circles). The abscissa is the ratio of the odor mixture components, fA/fB and the ordinate is the fraction of choices for the port associated with odor A. A sigmoid function was fitted to the choices of the rat on training stimuli (see Materials and methods section) using the odor mixture ratio as the independent variable. Error bars show ±1 SEM (see Materials and methods section). Some training data points are not visible because they are hidden behind the corresponding test data points. Note that the sigmoid also fits the test stimuli even they were not used in the fitting procedure. (C) The same data as (B) plotted using the magnitude of odor A (fA) as the independent variable. The fit is also performed using the magnitude of component A as the independent variable. Note that the fitted function does not accurately predict the probe responses. (D) Experiment with 1/10 dilution probe stimuli. Training stimuli (black filled circles) had fA + fB = 100. Test stimuli (red circles) were chosen such that fA + fB = 10. Note that in this experiment, dilution was achieved by liquid rather than air dilution. (E) Performance of one rat on training odors (black filled circles) and 1/10 dilution probes (red circles). The independent variable is the ratio fA/fB. (F) Choices of one rat on training and 1/10 dilution probe stimuli. The independent variable is the single component fA.
Figure 2
Figure 2
Odor mixture discrimination by component ratio generalizes to higher concentration probe stimuli. (A) Training stimuli (black filled circles) had fA + fB = 100. Test stimuli (red circles) were chosen such that fA + fB = 150. The training reward boundary is indicated by the magenta diamond. See Figure 1A for details. (B) Choices of one rat on training stimuli and test stimuli with higher concentration. The independent variable is the ratio fA/fB. Some training data points are not visible because they are hidden behind the corresponding test data points. (C) Choices of one rat on training and test stimuli. The independent variable is the single component fA.
Figure 3
Figure 3
Odor mixture discrimination boundary is not necessarily orthogonal to the training set. (A) Training stimuli (fA + fB = 100; black filled circles) and lower concentration test stimuli (fA + fB = 50; red circles). The training reward boundary is indicated by the magenta diamond. Note that the boundary shifted in this experiment to fA = 3·fB. The yellow line indicates the classification boundary for a ratio computation (fA/fB = 3) while the blue line indicates the classification boundary orthogonal to the training stimulus set (y = fA − fB = c). See also Figure 1A for details of legend. (B) Performance of one rat on training and test stimuli with a shifted training reward boundary. The independent variable is the ratio of mixture components fA/fB. (C) The same data as in (B) but where the independent variable is the difference of mixture components, fA − fB.

References

    1. Arctander S. (1969). Perfume and Flavor Chemicals (Aroma Chemicals). Las Vegas, NV, Steffen's Arctander's Publications.
    1. Baker T. C., Carde R. T., Roelofs W. L. (1976). Behavioral responses of male Argyrotaenia velutinana (Lepidoptera: Tortricidae) to components of its sex pheromone. J. Chem. Ecol. 2, 333–352 10.1007/BF00988281 - DOI
    1. Beauchamp G. K., Yamazaki K. (2003). Chemical signalling in mice. Biochem. Soc. Trans. 31, 147–151 - PubMed
    1. Boehm T., Zufall F. (2006). MHC peptides and the sensory evaluation of genotype. Trends Neurosci. 29, 100–107 10.1016/j.tins.2005.11.006 - DOI - PubMed
    1. Brody C. D., Hopfield J. J. (2003). Simple networks for spike-timing-based computation, with application to olfactory processing. Neuron 37, 843–852 10.1016/S0896-6273(03)00120-X - DOI - PubMed

LinkOut - more resources