. 2008 Oct 28;6(10):e223.
doi: 10.1371/journal.pbio.0060223.

The desensitization gating of the MthK K+ channel is governed by its cytoplasmic amino terminus

Affiliations

The desensitization gating of the MthK K+ channel is governed by its cytoplasmic amino terminus

Mario Meng-Chiang Kuo et al. PLoS Biol. .

Abstract

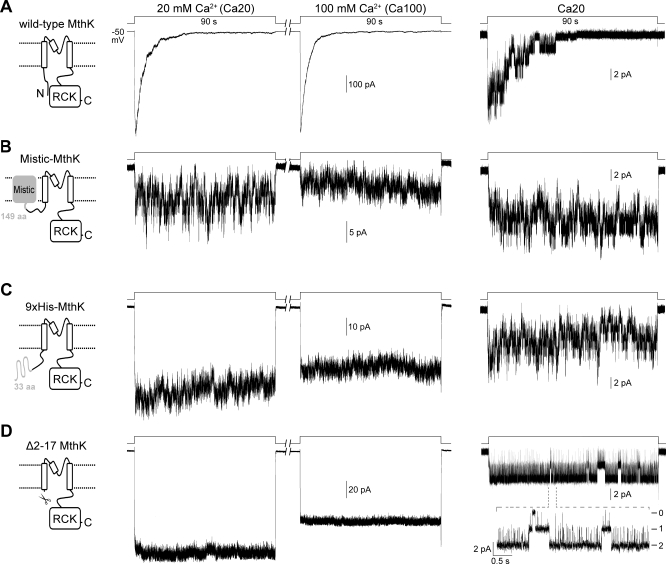
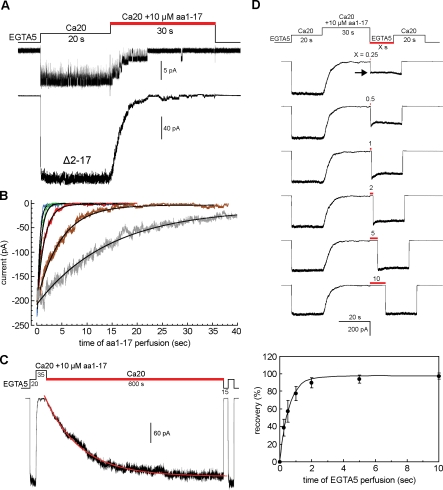
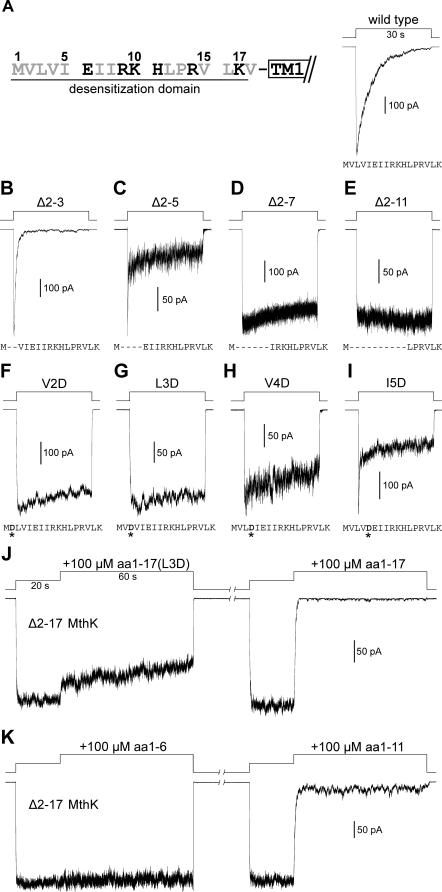
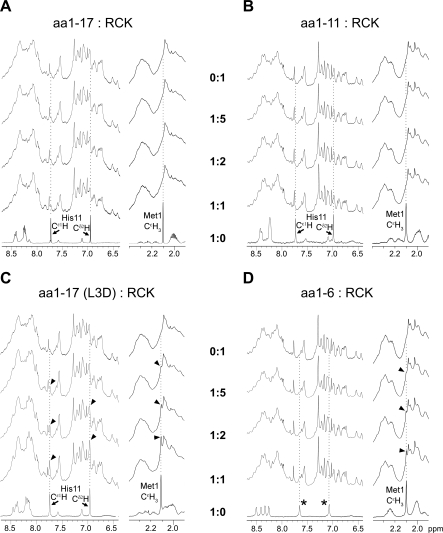
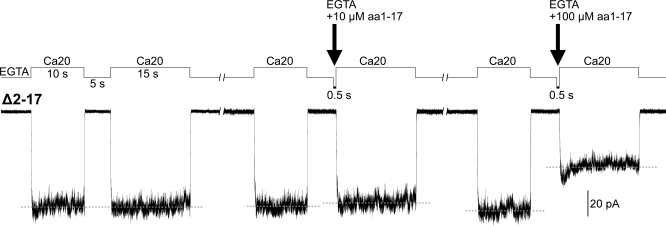
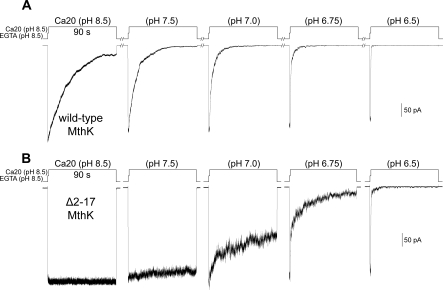
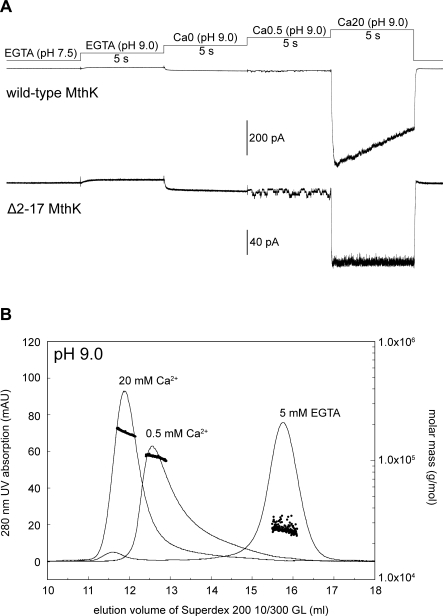
The RCK-containing MthK channel undergoes two inactivation processes: activation-coupled desensitization and acid-induced inactivation. The acid inactivation is mediated by the C-terminal RCK domain assembly. Here, we report that the desensitization gating is governed by a desensitization domain (DD) of the cytoplasmic N-terminal 17 residues. Deletion of DD completely removes the desensitization, and the process can be fully restored by a synthetic DD peptide added in trans. Mutagenesis analyses reveal a sequence-specific determinant for desensitization within the initial hydrophobic segment of DD. Proton nuclear magnetic resonance ((1)H NMR) spectroscopy analyses with synthetic peptides and isolated RCK show interactions between the two terminal domains. Additionally, we show that deletion of DD does not affect the acid-induced inactivation, indicating that the two inactivation processes are mutually independent. Our results demonstrate that the short N-terminal DD of MthK functions as a complete moveable module responsible for the desensitization. Its interaction with the C-terminal RCK domain may play a role in the gating process.


Conflict of interest statement

Competing interests. The authors have declared that no competing interests exist.

Figures

Figure 1
Figure 1. Representative Macro- and Microscopic Traces of Different MthK Constructs Expressed in E. coli Membrane
Excised inside-out patches were held at −50 mV. Macroscopic traces (left and middle, from same patches) were recorded from cells with IPTG treatment. Single-channel traces (right) were recorded from cells without IPTG treatment. Channels were activated by stepping the perfusate from EGTA to either Ca20 or Ca100 solution at pH 7.5 using a rapid perfusion system. (A) Traces of wild-type MthK. The macroscopic Ca2+-activated current decays in a few seconds after being activated by 20 (left trace) or 100 (middle trace) mM Ca2+. The single-exponential time constants for the decays are 5.7 ± 0.6 s and 4.2 ± 1.2 s (n = 6), respectively. Right trace, a single-channel trace shows that the channel's open probability decreases during the extended 20 mM Ca2+ perfusion. (B) A Mistic protein [16] was fused to the N-terminus of MthK to create the Mistic-MthK chimera (Materials and Methods). The traces show that the chimeric channels remain active during the prolonged Ca2+ perfusion. (C) Fusing a nona-histidine-containing peptide (Materials and Method) to the N-terminus of MthK also results in chimeric channels that remain active during the sustained Ca2+ perfusion. (D) The entire cytoplasmic N-terminus of MthK was deleted to create the Δ2–17 MthK. Macroscopic traces of the deletional mutant shows that the current does not decay in either 20 or 100 mM Ca2+. A single-channel trace with two active channels shows that the open probability does not decrease in the Ca2+ solution. Dashed lines indicate zoom in of a segment of the trace. All traces represent more than five independent patches.
Figure 2
Figure 2. Effects of Synthetic N-Terminal 17-Residue Peptide on the Δ2–17 MthK Channels
(A) A single-channel trace (top) shows that the channel open probability decreases when 10 μM synthetic peptide (aa1–17) was added to the perfusate (red bar). Bottom, a macroscopic trace shows that the Ca2+-activated current decays during the aa1–17 perfusion. The results indicate that the synthetic aa1–17 peptide is able to restore the desensitization phenomenon in trans. (B) Overlapped traces of the peptide-induced desensitization at different peptide concentrations. Smooth curves indicate single exponential fitting. Gray trace is 3 μM, which has a time constant of 14.75 ± 2.77 s; brown, 10 μM, 4.23 ± 1.34 s; red, 30 μM, 1.47 ± 0.34 s; green, 100 μM, 0.51 ± 0.13 s; blue, 1,000 μM, 0.37 ± 0.04 s (mean ± SD, n = 9–15). (C) A recording episode to determine the rate of recovery of the peptide desensitized channels back to the open state (red bar). The smooth curve shows single exponential fitting. The time constant is 135 ± 20 s (mean ± SD, n = 8). (D) Rate of recovery of the peptide desensitized channels back to the closed state (red bar). The time constant is 0.59 s (bottom panel, SDs are shown, n = 5).
Figure 3
Figure 3. Mutational Analyses at the Cytoplasmic N-Terminus of MthK.
Activation was done by stepping the perfusate from EGTA to Ca20 solutions at pH 7.5. (A) Left, amino acid sequence of the N-terminal desensitization domain (DD) of MthK. Hydrophobic residues are shown in gray. Right, a typical macroscopic trace of wild-type MthK. (B–E) Traces of sequential N-terminal deletion mutants show that truncations of DD result in significantly altered channel gating properties. (F–I) Traces of single-point mutations (asterisks) at the initial hydrophobic residues of the DD show that introducing a charged aspartate residue to disrupt the initial hydrophobicity drastically alters the gating profile. (J) Traces recorded from the same patch show the effects of 100 μM aa1–17(L3D) peptide (left trace) and aa1–17 peptide (right trace) on open Δ2–17 MthK channels. (K) Traces from the same patch, containing Δ2–17 MthK channels, show the effects of the aa1–6 (left trace) and aa1–11 (right trace) peptides. Typical traces are shown, representing four to six independent patches for (B–K).
Figure 4
Figure 4. The 700-MHz 1H NMR Spectra of Isolated RCK Domain Titration by Synthetic Peptides
The regions of 8.7…6.4 ppm and 2.4…1.9 ppm of the spectra are shown. The spectrum of the RCK domain without peptide is shown in the top rows; spectra of free peptides are shown in the bottom rows. Characteristic peaks are traced with the dotted lines. (A and B) Isolated RCK protein titrated with aa1–17 and aa1–11 peptides. The three characteristic peaks of the peptides disappeared when mixed with the RCK protein. (C and D) Isolated RCK protein titrated with the mutant aa1–17(L3D) and aa1–6 peptides. The characteristic peptide peaks are clearly detected in the peptide-RCK mixtures (arrowheads). Asterisks indicate peaks from the protons of the C-terminal amide group.
Figure 5
Figure 5. Behavior of Δ2–17 MthK upon the Perfusion of Synthetic aa1–17 Peptide to the Cytoplasmic Side of the Patch When the Channels Are in the Closed State
Left, trace of two Ca2+-activation peaks shows the channels in the excised patch, after being activated by the first Ca20 perfusion, are able to return fully to the closed state during the 5-s EGTA perfusion. Dashed lines indicate the average amplitude of the peaks. Middle and right, traces show the effects of adding 10 and 100 μM DD peptide (arrows) to the closed channels, respectively. Traces are from a single patch, representing five independent patches.
Figure 6
Figure 6. Behavior of Wild-Type and Δ2–17 MthK in Response to the pH of the Cytoplasmic Side
The channels were activated by stepping the perfusate from EGTA (pH 8.5) to Ca20 (pH 8.5) solutions for 1 s, and then to Ca20 solution at different pH values for 90 s. (A) Traces of wild-type MthK currents recorded from the same patch, representing five independent patches. After each activation episode, the patch was perfused with EGTA (pH 8.5) solution for more than 8 min for the channels to recover back to the closed state. (B) Traces of Δ2–17 MthK show that the currents were inactivated by neutral to slightly acidic pH. Ensemble currents of three independent patches are shown.
Figure 7
Figure 7. Behavior of MthK and the Isolated RCK Domain in Response to Ca2+ at pH 9.0
(A) Representative macroscopic traces of wild-type MthK (upper trace) and Δ2–17 MthK (bottom trace) show that stepping the perfusate from EGTA (pH 7.5) to EGTA (pH 9.0) then to Ca0 (pH9.0) solution does not activate the channels. Activation of MthK at pH 9.0 still requires sub- to millimolar concentrations of Ca2+ (last 2 steppings). Digitized at 2.5 kHz and filtered at 1 kHz. Ca0, Ca0.5, and Ca20 solutions contain (in mM) 10 Tris-HCl (pH 9.0), 150 KCl, 500 sucrose, and 0, 0.5, or 20 CaCl2, respectively. (n = 3 patches). (B) Oligomeric states of the isolated RCK domain at pH 9.0 in the presence of EGTA or Ca2+, determined by size-exclusion chromatography (smooth lines) and static light scattering (dots). The retention volumes for each of the corresponding peaks are 11.9 ml (20 mM Ca2+), 12.6 ml (0.5 mM Ca2+), and 15.8 ml (5 mM EGTA). Molar masses for each of the corresponding peaks are 170 ± 10 kDa (20 mM Ca2+), 106 ± 4 kDa (0.5 mM Ca2+), and 26.5 ± 2.3 kDa (5 mM EGTA).

References

    1. Gu C, Jan YN, Jan LY. A conserved domain in axonal targeting of Kv1 (Shaker) voltage-gated potassium channels. Science. 2003;301:646–649. - PubMed
    1. Hille B. Ion channels of excitable membranes. Sunderland (Massachusetts): Sinauer Associates; 2001. 814
    1. Nishida M, Cadene M, Chait BT, MacKinnon R. Crystal structure of a Kir3.1-prokaryotic Kir channel chimera. EMBO J. 2007;26:4005–4015. - PMC - PubMed
    1. Pegan S, Arrabit C, Zhou W, Kwiatkowski W, Collins A, et al. Cytoplasmic domain structures of Kir2.1 and Kir3.1 show sites for modulating gating and rectification. Nat Neurosci. 2005;8:279–287. - PubMed
    1. Roosild TP, Le KT, Choe S. Cytoplasmic gatekeepers of K+-channel flux: a structural perspective. Trends Biochem Sci. 2004;29:39–45. - PubMed

Publication types

MeSH terms

LinkOut - more resources